Level 4 of the series on silverpoint brings everything together in a final project. The previous levels built the operations panel piece by piece: the grid dashboard, the UI components, the export, server rendering and live data. This article puts them together in a React application with Next.js and its App Router, with three pages and a shared theme.
Articles 24, 25 and 26 build the same application in Vue, Angular and Reflex, and 27 compares them. That is why the three pages are the same in all four.
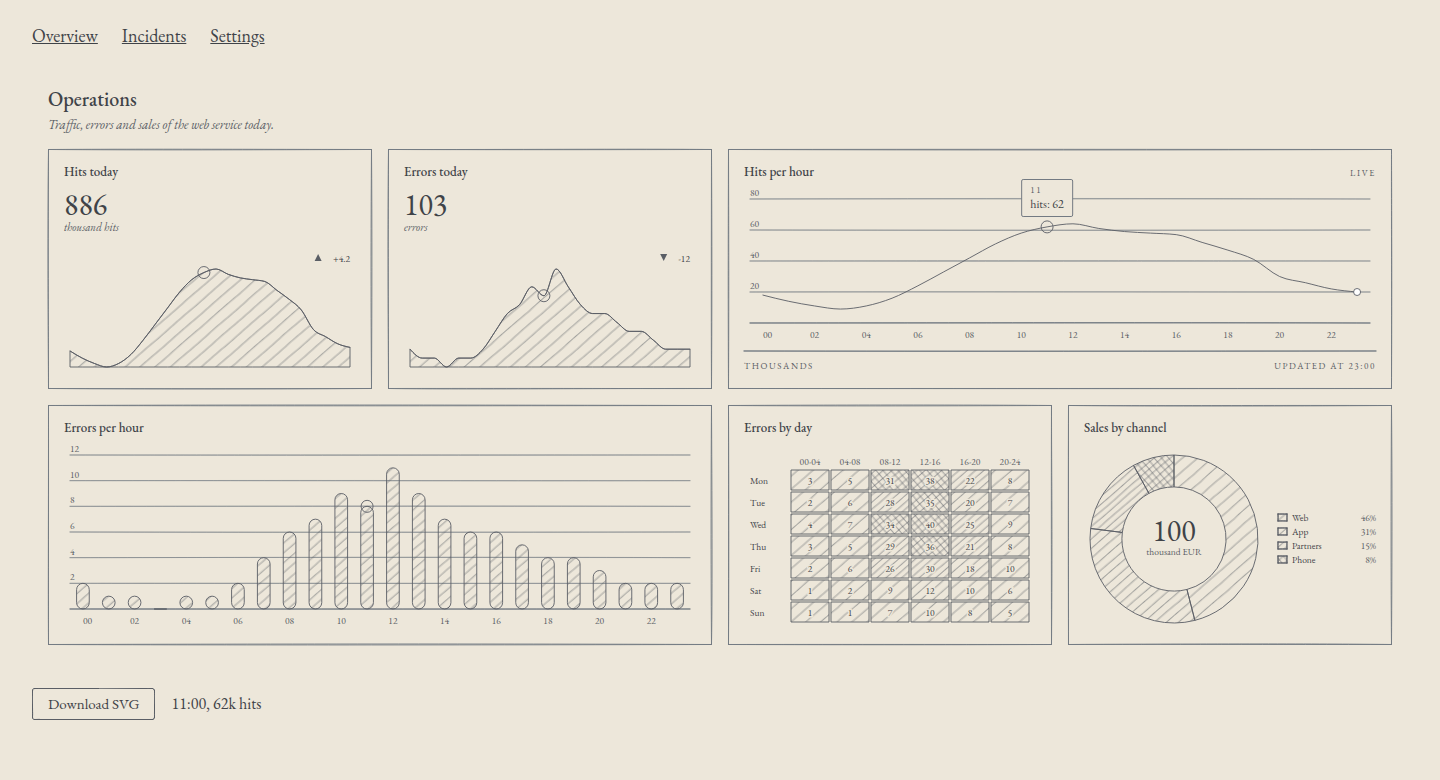
What you will build
| Route | Page | Comes from |
|---|---|---|
/ | The overview: indicators, live traffic, errors linked by hour, errors per day, sales by channel, a readout of the active hour and an SVG download button | Articles 11, 13, 18 and 20 |
/incidents | The sortable, paginated incidents table, with the modal to acknowledge an incident and the toast | Article 17 |
/settings | The theme, a ground and a palette that change the whole application, and the alert rule form | Articles 09, 12 and 16 |
A navigation bar with three links ties them together. The settings last for the session: as you go back and forth between pages, the theme and the saved rule are still there. Reloading the page brings back the defaults.
What you need
- Node.js 20.9 or later, the minimum for Next.js 16. I tested it with Node.js 24.
- Next.js 16.4.6, React 19.3.0 and silverpoint 0.10.1.
The project
Create the application and install silverpoint:
npx create-next-app@latest ops-panel --ts --app --no-tailwind --no-eslint --no-src-dir --no-react-compiler --import-alias "@/*" --use-npm --yes
cd ops-panel
npm install @silverpoint/react @silverpoint/core @silverpoint/grounds @silverpoint/fonts
@silverpoint/core is installed separately because the code imports the palettes and the ActiveItem type from it, as in article 12. Delete app/page.module.css and the images in public/, which the template ships as examples. When you are done, the project looks like this:
ops-panel/
├── app/
│   ├── layout.tsx                server: stylesheets, title, navigation
│   ├── globals.css
│   ├── settings-provider.tsx     client: settings and SilverpointProvider
│   ├── page.tsx                  server: the / route
│   ├── overview.tsx              client: the dashboard
│   ├── incidents/
│   │   ├── page.tsx              server: the /incidents route
│   │   └── incidents.tsx         client: table, modal and toast
│   └── settings/
│       ├── page.tsx              server: the /settings route
│       ├── theme-form.tsx        client: ground and palette
│       └── alert-rule-form.tsx   client: the alert rule
├── lib/
│   ├── ops.ts                    the panel's data
│   ├── live.ts                   the rolling window
│   ├── incidents.ts              the 12 incidents
│   ├── rule.ts                   the alert rule
│   └── download.ts               the SVG download
├── next.config.ts
├── package.json
└── tsconfig.json
Three files in lib/ come unchanged from earlier articles: lib/ops.ts is the one from article 13, with the hourly rows, errors per day and sales by channel; lib/incidents.ts is the one from article 17, and lib/download.ts, the one from article 18.
Server or client
In the App Router, every file is a server component unless it starts with 'use client'. A server component sends no JavaScript to the browser, but it cannot have state, effects or events, or read a React context.
| File | Where | Why |
|---|---|---|
app/layout.tsx | Server | The stylesheets, the title and the navigation do not change |
app/page.tsx, app/incidents/page.tsx, app/settings/page.tsx | Server | Each page's title and headings |
app/settings-provider.tsx | Client | It keeps the settings in state and shares them through a context |
app/overview.tsx | Client | The live-data interval, the readout, the download and the theme |
app/incidents/incidents.tsx | Client | The sort order, the page, the modal and the toast are state |
app/settings/theme-form.tsx, app/settings/alert-rule-form.tsx | Client | They are forms |
Article 19 drew the charts with the server entries, @silverpoint/react/server/.... They do not work here: the theme lives in client state and arrives through the context of SilverpointProvider, which a server component cannot read. A server chart would keep the default theme when you change it in /settings. That is why every chart is a client component.
That does not leave them out of the HTML. Next.js also renders client components at build time, and inside a Dashboard every chart gets the size of its cell. Article 19 explained that a client chart without width reaches the HTML as a placeholder with data-status="deferred". Inside the dashboard that does not happen: the HTML of / carries all six charts drawn, with data-status="ready", before a single line of JavaScript loads.
The configuration
next.config.ts is the one from the create-next-app template, unchanged:
import type { NextConfig } from 'next';

const nextConfig: NextConfig = {
  cacheComponents: true,
  partialPrefetching: true,
};

export default nextConfig;
The SVG download from article 18 needs nothing here. standaloneSVG receives the ground's stylesheet from @silverpoint/grounds/styles-text, a JavaScript module that Turbopack imports with no rule.
Up to 0.9.2 you had to import styles.css as text with ?raw, and in Turbopack that needed a rule in turbopack.rules, a path relative to node_modules and a type declaration. 0.10.0 made it unnecessary (issue #14).
The shared layout
app/layout.tsx is the only place where the stylesheets are loaded: the fonts, the ground and the one for the UI components from article 16. It wraps every page in the settings and adds the navigation:
import type { Metadata } from 'next';
import Link from 'next/link';
import '@silverpoint/fonts/fonts.css';
import '@silverpoint/grounds/styles.css';
import '@silverpoint/grounds/ui.css';
import './globals.css';
import { SettingsProvider } from './settings-provider';

export const metadata: Metadata = {
  title: { default: 'Operations', template: '%s · Operations' },
  description: 'Traffic, errors, incidents and alert rules of the web service.',
};

export default function RootLayout({ children }: LayoutProps<'/'>) {
  return (
    <html lang="en">
      <body>
        <SettingsProvider>
          <nav aria-label="Main">
            <Link href="/">Overview</Link>
            <Link href="/incidents">Incidents</Link>
            <Link href="/settings">Settings</Link>
          </nav>
          <main>{children}</main>
        </SettingsProvider>
      </body>
    </html>
  );
}
LayoutProps<'/'> is a global type that Next.js generates from the routes. title.template makes the title of /incidents read "Incidents · Operations".
The navigation and main are server components, but they sit inside SettingsProvider, which is a client component. Next.js allows it: a client component can receive server components as children. What you cannot do is import a server component from a client one.
Link navigates without reloading the page. The layout is not mounted again when the route changes, so the state of SettingsProvider is kept.
The theme and the settings
app/settings-provider.tsx keeps the settings in state: the ground, the palette and the alert rule. It shares them through a context and passes the theme to SilverpointProvider:
'use client';

import { createContext, useContext, useState, type CSSProperties, type ReactNode } from 'react';
import type { GroundName, Palette } from '@silverpoint/core';
import { PALETTES, paletteStyle, type PaletteName } from '@silverpoint/core/palettes';
import { SilverpointProvider } from '@silverpoint/react/provider';
import { DEFAULT_RULE, type AlertRule } from '@/lib/rule';

export type Settings = {
  ground: GroundName;
  palette: PaletteName;
  rule: AlertRule;
};

type SettingsContextValue = {
  settings: Settings;
  palette: Palette | undefined;
  update: (change: Partial<Settings>) => void;
};

const SettingsContext = createContext<SettingsContextValue | null>(null);

export function useSettings(): SettingsContextValue {
  const value = useContext(SettingsContext);
  if (!value) throw new Error('useSettings() needs a <SettingsProvider> above it');
  return value;
}

// The palette's --sp-* declarations as a React style object, so the page
// itself is painted with the same substrate and text colours as the charts.
function paletteVars(palette: Palette | undefined): CSSProperties {
  const pairs = paletteStyle(palette)
    .split(';')
    .filter(Boolean)
    .map((declaration) => declaration.split(':'));
  return Object.fromEntries(pairs);
}

export function SettingsProvider({ children }: { children: ReactNode }) {
  const [settings, setSettings] = useState<Settings>({
    ground: 'silverpoint',
    palette: 'silverpoint',
    rule: DEFAULT_RULE,
  });

  const update = (change: Partial<Settings>) => setSettings((current) => ({ ...current, ...change }));
  // Cyanotype brings its own colours; a palette only applies to silverpoint.
  const palette = settings.ground === 'silverpoint' ? PALETTES[settings.palette] : undefined;

  return (
    <SettingsContext value={{ settings, palette, update }}>
      <SilverpointProvider ground={settings.ground} palette={palette}>
        <div className={`shell sp-ground-${settings.ground}`} data-substrate="cream" style={paletteVars(palette)}>
          {children}
        </div>
      </SilverpointProvider>
    </SettingsContext>
  );
}
Three decisions in this file:
- Cyanotype takes no palette. It brings its own colours, as article 12 explained. With
ground="cyanotype",paletteisundefined, and in/settingsthe palette select is disabled. - The page changes colour too.
SilverpointProviderdraws no element: it only hands the configuration to the charts and components below it. So that the page background follows the theme, thedivthat wraps the application carries the ground's class,sp-ground-silverpointorsp-ground-cyanotype, and the palette's--sp-*properties.paletteStylereturns those declarations as text;paletteVarsturns them into a React style object. With that,background: var(--sp-substrate)inglobals.csspaints the page with the theme's substrate. - The context also provides the resolved palette. The overview dashboard needs it, as shown below.
The ground stylesheets declare their properties inside :where(), with no weight, precisely so that a rule of yours can change them. That is why the ground's class also works on an element that is not a chart.
The styles
app/globals.css in full:
body {
  margin: 0;
}

.shell {
  min-height: 100vh;
  padding: 24px 32px;
  background: var(--sp-substrate);
  color: var(--sp-text);
  font-family: var(--sp-font-display);
}

nav {
  display: flex;
  gap: 24px;
  margin-bottom: 24px;
  font-size: 18px;
}

nav a {
  color: inherit;
}

h1 {
  margin: 0 0 16px;
  font-weight: 500;
}

.toolbar {
  display: flex;
  gap: 16px;
  align-items: center;
  margin-top: 16px;
}

.stack {
  display: grid;
  gap: 16px;
  align-content: start;
  justify-items: start;
  max-width: 720px;
}

.sp-table {
  justify-self: stretch;
}

button[aria-haspopup='dialog'] {
  padding: 6px 14px;
  border: 1px solid currentColor;
  border-radius: 2px;
  background: transparent;
  color: inherit;
  font: inherit;
  cursor: pointer;
}

form {
  display: grid;
  gap: 20px;
  align-content: start;
}

.settings {
  display: grid;
  grid-template-columns: repeat(auto-fit, minmax(320px, 1fr));
  gap: 48px;
}

h2 {
  margin: 0;
  font-weight: 500;
}
.stack is a column for the incidents content and for each settings block. At first it was a rule on section, as in article 17, but Dashboard is a section too: with max-width: 720px the dashboard went from four columns to two.
Live data and the alert rule
lib/live.ts is the rolling window from article 20, now over the panel's rows. Each new reading copies that hour's row, with its errors, and changes the hits:
import { hourly, type HourRow } from './ops';

// The next reading: the hour after the last one, taken from the day's
// profile with a small variation that changes from tick to tick.
export function nextReading(last: HourRow, tick: number): HourRow {
  const hour = (Number(last.hour) + 1) % 24;
  return { ...hourly[hour], hits: hourly[hour].hits + ((tick * 7) % 9) - 4 };
}

// A rolling window: drop the oldest hour and append the new one.
export function advance(rows: readonly HourRow[], tick: number): HourRow[] {
  return [...rows.slice(1), nextReading(rows[rows.length - 1], tick)];
}
lib/rule.ts describes the alert rule from article 16. It used to be the form's state; now it is one more setting, so the saved rule is still there when you come back to /settings:
export type AlertRule = {
  metric: string;
  threshold: number;
  channel: string;
  active: boolean;
  notes: string;
};

export const DEFAULT_RULE: AlertRule = {
  metric: 'errors',
  threshold: 10,
  channel: 'email',
  active: true,
  notes: '',
};

export function describeRule(rule: AlertRule): string {
  const state = rule.active ? 'active' : 'paused';
  return `${rule.metric} ≥ ${rule.threshold}, by ${rule.channel}, ${state}. Notes: ${rule.notes || '—'}`;
}
The overview
app/page.tsx is a server component that only renders the dashboard:
import { Overview } from './overview';

export default function OverviewPage() {
  return <Overview />;
}
And app/overview.tsx, the dashboard from article 13 with live data, the readout and the download:
'use client';

import { useEffect, useRef, useState } from 'react';
import type { ActiveItem } from '@silverpoint/core';
import { BarChart } from '@silverpoint/react/bar-chart';
import { Dashboard, DashboardCell, type DashboardLayout } from '@silverpoint/react/dashboard';
import { DonutChart } from '@silverpoint/react/donut-chart';
import { HeatmapChart } from '@silverpoint/react/heatmap-chart';
import { KpiCard } from '@silverpoint/react/kpi-card';
import { LineChart, type ChartHandle } from '@silverpoint/react/line-chart';
import { SpButton } from '@silverpoint/react/ui/button';
import { downloadSvg } from '@/lib/download';
import { advance } from '@/lib/live';
import { blocks, errorsByDay, hourly, sales } from '@/lib/ops';
import { useSettings } from './settings-provider';

const layout: DashboardLayout = {
  columns: { sm: 1, md: 2, lg: 4 },
  rowHeight: 240,
  gap: 16,
  cells: [
    { id: 'hits-today' },
    { id: 'errors-today' },
    { id: 'traffic', colSpan: { md: 2, lg: 2 } },
    { id: 'errors-hour', colSpan: { md: 2, lg: 2 } },
    { id: 'errors-day' },
    { id: 'channels' },
  ],
};

export function Overview() {
  const { settings, palette } = useSettings();
  const [rows, setRows] = useState(hourly);
  const [active, setActive] = useState<ActiveItem | null>(null);
  const chart = useRef<ChartHandle>(null);

  useEffect(() => {
    let tick = 0;
    const timer = setInterval(() => {
      tick += 1;
      setRows((current) => advance(current, tick));
    }, 2000);
    return () => clearInterval(timer);
  }, []);

  const last = rows[rows.length - 1];

  const exportChart = () => {
    const svg = chart.current?.toSVGString();
    if (svg) downloadSvg(svg, 'hits-per-hour.svg');
  };

  return (
    <>
      <Dashboard
        id="ops"
        title="Operations"
        description="Traffic, errors and sales of the web service today."
        layout={layout}
        link={{ key: 'hour' }}
        ground={settings.ground}
        palette={palette}
      >
        <DashboardCell cell="hits-today">
          <KpiCard title="Hits today" data={hourly} valueKey="hits" value={886} unit="thousand hits" delta={4.2} />
        </DashboardCell>
        <DashboardCell cell="errors-today">
          <KpiCard title="Errors today" data={hourly} valueKey="errors" value={103} unit="errors" delta={-12} />
        </DashboardCell>
        <DashboardCell cell="traffic">
          <LineChart
            ref={chart}
            id="live-hits"
            title="Hits per hour"
            badge="Live"
            data={rows}
            xKey="hour"
            valueKey="hits"
            footerLeft="Thousands"
            footerRight={`Updated at ${last.hour}:00`}
            onActiveChange={setActive}
          />
        </DashboardCell>
        <DashboardCell cell="errors-hour">
          <BarChart title="Errors per hour" data={hourly} xKey="hour" valueKey="errors" />
        </DashboardCell>
        <DashboardCell cell="errors-day">
          <HeatmapChart
            title="Errors by day"
            data={errorsByDay}
            labelKey="day"
            valuesKey="values"
            columnLabels={blocks}
            scaleMax={40}
          />
        </DashboardCell>
        <DashboardCell cell="channels">
          <DonutChart title="Sales by channel" data={sales} nameKey="channel" valueKey="sales" centerLabel="thousand EUR" />
        </DashboardCell>
      </Dashboard>
      <div className="toolbar">
        <SpButton onClick={exportChart}>Download SVG</SpButton>
        <p>{active ? `${String(active.datum.hour)}:00, ${active.value}k hits` : 'Point at an hour'}</p>
      </div>
    </>
  );
}
What each part does:
- Live data. The interval from article 20 adds a reading every 2 seconds and drops the oldest one. The traffic chart has
id="live-hits", a stable identifier: without it, each render could change the seed and the stroke would wobble differently on every reading. The footer gives the hour of the latest reading. - Linked charts. With
link={{ key: 'hour' }}, the pointer on an hour of the traffic marks the same hour in the errors and in the curves of the two indicators, and the other way round. Errors per day and sales by channel do not have thehourfield: they show no mark and in development warn withSP016, as article 13 explained. - The readout. The traffic chart's
onActiveChangestores the active item, as in article 11, and the paragraph writes "11:00, 62k hits". It only follows the traffic chart: the marks the link adds do not change it. To follow the linked value, useonLinkChange, from article 13. - The download.
refgives the chart's handle, andtoSVGString()the SVG, as in article 18. The file carries the palette of the chosen theme. - The dashboard theme.
groundandpaletteare passed to theDashboard, on top of arriving through the provider. Since 0.10.0 the dashboard frame follows the provider (issue #17), but in this application both values are still needed. When you change the theme in/settings, the overview is hidden. Without them, on coming back in the production build, the frame took the new theme and the six charts kept the old one until the next live reading, about 2 seconds later. With them,Overviewreads the settings, renders again when it is shown and everything changes at once.
The incidents
app/incidents/page.tsx is a server component, with its title and its heading:
import type { Metadata } from 'next';
import { Incidents } from './incidents';

export const metadata: Metadata = { title: 'Incidents' };

export default function IncidentsPage() {
  return (
    <>
      <h1>Incidents</h1>
      <Incidents />
    </>
  );
}
app/incidents/incidents.tsx is the Incidents component from article 17 with three changes: the first line, 'use client'; the path of the data, which now lives in lib/; and the stack class on the section. The start of the file looks like this:
'use client';

import { useState } from 'react';
import { uiSortRows } from '@silverpoint/core/ui';
import { SpButton } from '@silverpoint/react/ui/button';
import { SpModal } from '@silverpoint/react/ui/modal';
import { SpPagination } from '@silverpoint/react/ui/pagination';
import { SpSelect } from '@silverpoint/react/ui/select';
import { SpTable } from '@silverpoint/react/ui/table';
import { SpToast, SpToaster } from '@silverpoint/react/ui/toast';
import { COLUMNS, INCIDENTS, PAGE_SIZE } from '@/lib/incidents';
The rest is the same: the sortable table, pagination five at a time, the modal with its native button as trigger, and the toast.
The settings
app/settings/page.tsx renders the two blocks, side by side on a wide screen:
import type { Metadata } from 'next';
import { AlertRuleForm } from './alert-rule-form';
import { ThemeForm } from './theme-form';

export const metadata: Metadata = { title: 'Settings' };

export default function SettingsPage() {
  return (
    <>
      <h1>Settings</h1>
      <div className="settings">
        <section className="stack">
          <h2>Theme</h2>
          <ThemeForm />
        </section>
        <section className="stack">
          <h2>Alert rule</h2>
          <AlertRuleForm />
        </section>
      </div>
    </>
  );
}
app/settings/theme-form.tsx changes the theme. It has no save button: each change applies at once.
'use client';

import { PALETTE_NAMES } from '@silverpoint/core/palettes';
import { SpSegmented } from '@silverpoint/react/ui/segmented';
import { SpSelect } from '@silverpoint/react/ui/select';
import { useSettings } from '../settings-provider';

const GROUNDS = [
  { key: 'silverpoint', label: 'Silverpoint' },
  { key: 'cyanotype', label: 'Cyanotype' },
];

export function ThemeForm() {
  const { settings, update } = useSettings();

  return (
    <>
      <SpSegmented
        label="Ground"
        name="ground"
        items={GROUNDS}
        value={settings.ground}
        onChange={(ground) => update({ ground: ground === 'cyanotype' ? 'cyanotype' : 'silverpoint' })}
      />
      <SpSelect
        label="Palette"
        items={PALETTE_NAMES}
        value={settings.palette}
        onChange={(name) => {
          const palette = PALETTE_NAMES.find((candidate) => candidate === name);
          if (palette) update({ palette });
        }}
        disabled={settings.ground === 'cyanotype'}
      />
    </>
  );
}
PALETTE_NAMES are the names of the six palettes, from silverpoint to indigo. When you pick one, update stores it, the provider receives the new palette and everything below it is repainted: the charts, the dashboard, the table, the buttons and the page background. When the palette changes, the data is not drawn again: only the --sp-* properties change.
SpSelect hands a string to onChange, and palette is a PaletteName, the type of the six names since 0.10.0 (issue #20). That is why the name is looked up in PALETTE_NAMES before it is stored.
app/settings/alert-rule-form.tsx is the form from article 16. Its fields start from the saved rule and, on submit, store it in the settings:
'use client';

import { useState, type FormEvent } from 'react';
import { SpButton } from '@silverpoint/react/ui/button';
import { SpRadioGroup } from '@silverpoint/react/ui/radio-group';
import { SpSegmented } from '@silverpoint/react/ui/segmented';
import { SpSlider } from '@silverpoint/react/ui/slider';
import { SpSwitch } from '@silverpoint/react/ui/switch';
import { SpTextarea } from '@silverpoint/react/ui/textarea';
import { describeRule } from '@/lib/rule';
import { useSettings } from '../settings-provider';

const METRICS = [
  { key: 'errors', label: 'Errors' },
  { key: 'hits', label: 'Hits' },
];

const CHANNELS = [
  { key: 'email', label: 'Email' },
  { key: 'chat', label: 'Chat' },
  { key: 'sms', label: 'SMS', disabled: true },
];

export function AlertRuleForm() {
  const { settings, update } = useSettings();
  const [metric, setMetric] = useState(settings.rule.metric);
  const [threshold, setThreshold] = useState(settings.rule.threshold);
  const [channel, setChannel] = useState(settings.rule.channel);
  const [active, setActive] = useState(settings.rule.active);

  function save(event: FormEvent<HTMLFormElement>) {
    event.preventDefault();
    const notes = String(new FormData(event.currentTarget).get('notes') ?? '');
    update({ rule: { metric, threshold, channel, active, notes } });
  }

  return (
    <form onSubmit={save}>
      <SpSegmented label="Metric" name="metric" items={METRICS} value={metric} onChange={setMetric} />
      <SpSlider
        label="Threshold"
        name="threshold"
        min={0}
        max={50}
        step={5}
        marks={[0, 25, 50]}
        value={threshold}
        onChange={setThreshold}
      />
      <SpRadioGroup
        label="Notify by"
        name="channel"
        items={CHANNELS}
        orientation="horizontal"
        value={channel}
        onChange={setChannel}
      />
      <SpSwitch label="Active" name="active" checked={active} onChange={setActive} />
      <SpTextarea
        label="Notes"
        placeholder="Notes for the on-call team"
        name="notes"
        rows={2}
        maxLength={200}
        showCount
        defaultValue={settings.rule.notes}
      />
      <SpButton type="submit" variant="primary">
        Save rule
      </SpButton>
      <p role="status">Saved rule: {describeRule(settings.rule)}</p>
    </form>
  );
}
What Next.js keeps when you navigate
The template turns on cacheComponents. With that option, Next.js does not unmount the page you leave: it hides it with React's <Activity> component and keeps its state and its HTML. It does this for the last three routes visited, which in this application is all of them.
I checked it in the production build:
- I acknowledged INC-1038, sorted by minutes, went through the other two pages and came back: the table was still sorted by minutes and INC-1038 was still
acknowledged. - While the overview is hidden, React unmounts its effects, so the interval stops. Coming back after 6.5 seconds, the footer still said "Updated at 01:00", and 2 seconds later it moved to "Updated at 02:00": the window carries on from where it stopped, with no jumps.
- When you leave the overview no warning appears in the console, not even in development. Up to 0.9.2, each hidden chart warned with
SP003, because an element withdisplay: nonemeasures 0 px. Since 0.10.0, a hidden chart keeps its last width (silverpoint#22).
That is why keeping the rule in the settings is not essential with three routes: the form would also be kept while hidden. But an application with more pages loses the oldest ones, and the settings should live somewhere that does not depend on that.
Run, build and deploy
In development:
npm run devThe application runs at http://localhost:3000. For the production build:
npm run build
npm run start
npm run build compiled in 7.6 seconds and marked all four routes as static:
Route (app)
┌ ○ /
├ ○ /_not-found
├ ○ /incidents
└ ○ /settings


○  (Static)  prerendered as static content
All four are generated as HTML at build time. There is nothing to compute per request: the data is fixed and the live data is generated in the browser.
To deploy on Vercel, push the project to a Git repository and import it from vercel.com/new. Vercel recognises Next.js and uses next build with no configuration. You can also deploy from the project folder with its command line, npx vercel. The static pages are served from Vercel's network, and each push to the repository creates a new deployment with its own address. There are no environment variables to set. I did not deploy it; I tested it with npm run start.
The checks
I tested the application with Playwright and Chrome, first against npm run dev and then against the production build, with 29 checks. All of them passed in both cases. The main ones:
| What | How | Result |
|---|---|---|
| The dashboard | Wait for the six .sp-root with data-status="ready" | All six ready, also in the HTML without JavaScript |
| Live data | Read the traffic footer, wait 4.5 s and read it again | "Updated at 23:00" becomes "Updated at 01:00" |
| The link | Move the pointer over the error bars | The hour is marked in the traffic and in the two indicators |
| The readout | Move the pointer over the traffic | "14:00, 59k hits"; on leaving, "Point at an hour" |
| The download | Click "Download SVG" | hits-per-hour.svg, with <style><![CDATA[ and the ground; opened on its own in Chrome, it looks the same as on the page |
| The table | Click the "Minutes" header | The first row changes from INC-1042 to INC-1041 |
| The modal and the toast | Pick INC-1038 and click "Acknowledge" | The modal closes and "INC-1038 no longer pages the on-call team." appears |
| The form | Pick Hits, turn Active off, write a note and save | "Saved rule: hits ≥ 10, by email, paused. Notes: Page the database team", unchanged when you come back to the page |
| Cyanotype | Pick it in /settings and go back to the overview | The page and dashboard background becomes rgb(27, 63, 107), the six charts carry sp-ground-cyanotype and the table writes in white |
| A palette | Go back to Silverpoint and pick sanguine | The background becomes rgb(242, 232, 220), the charts carry --sp-ink: #8A3A24, and so does the downloaded SVG |
| The console | Collect errors and warnings | In production, none. In development, only SP016, explained above |
npx tsc --noEmit and the production build, which checks the types, passed too.
What it costs
I measured the production build with gzip:
| Route | HTML | JavaScript | CSS |
|---|---|---|---|
/ | 77.8 kB (11.7 kB with gzip) | 734.0 kB (230.0 kB with gzip) | 150.0 kB (15.3 kB with gzip) |
/incidents | 18.2 kB (3.8 kB with gzip) | 694.6 kB (217.3 kB with gzip) | 150.0 kB (15.3 kB with gzip) |
/settings | 17.8 kB (3.7 kB with gzip) | 692.8 kB (216.6 kB with gzip) | 150.0 kB (15.3 kB with gzip) |
The HTML of / is heavier because it carries the six charts drawn. The six charts were ready 25 ms after navigation started, median of three loads on my machine and on localhost: they arrive in the HTML.
The JavaScript is similar on the three routes. With silverpoint 0.9.2 it weighed more: 995.2 kB on / and 1025 kB across all routes. The provider was imported from the general entry, @silverpoint/react, which contains every chart, and Turbopack did not drop the ones the application does not use (silverpoint#21). With 0.10.1, the total is 763.7 kB, 239.7 kB with gzip.
0.10.0 also added a path of its own for the provider, @silverpoint/react/provider, which is the one settings-provider.tsx uses. In this application I measured the same importing it from either path.
The UI components stylesheet, ui.css, is most of the CSS.
Common problems
Can't resolve '@silverpoint/grounds/styles.css'with?raw. Turbopack does not apply the query to the package path. Import the stylesheet from@silverpoint/grounds/styles-text, without?raw.- The build fails with
TS7053onPALETTES[...]. Since 0.10.0,PALETTESonly accepts the six names ofPaletteName. Declarepalettewith that type, not asstring. - A chart does not change with the theme. It is a server component, which does not read the context. Move the chart to a client component.
- On coming back from
/settings, the dashboard's charts keep the old theme for a few seconds.groundandpaletteare missing on theDashboard. Pass them from the component that renders it, as inapp/overview.tsx. - The dashboard has two columns on a wide screen. A rule in your CSS on
sectiongives it a maximum width:Dashboardis asection. SP003warnings when changing page in development. You have a version before 0.10.0, which warned about the charts of the hidden page (silverpoint#22).useSettings() needs a <SettingsProvider> above it. The component renders outsideSettingsProvider. Everything that usesuseSettings()has to be inside a page or the shared layout, underapp/layout.tsx.
What comes next
Article 24 builds the same application in Vue, with Vite and vue-router. The pages, the data and the checks are the same, so that article 27 can compare the four versions.