A chart in the operations panel lives inside the page. Sometimes you need to take it out: paste it into a report, a slide deck or an email. This article in the series on silverpoint adds a button to the traffic chart that downloads it as an SVG file.
Every chart is already an SVG, so exporting it does not mean drawing it again. What you need to know is what that SVG carries and what it does not, because outside the application it does not have the page's stylesheet.
The chart's handle
Every chart exposes a handle with two methods:
| Method | What it returns |
|---|---|
toSVGString() | The chart's SVG as it is drawn, as text |
getGeometry() | The drawing's geometry: viewBox, strokes, text and hit areas |
The shape of the objects getGeometry() returns is internal: the library's specification warns that it may change in a minor version. For exporting, toSVGString() is enough.
How you reach the handle depends on the framework:
| Framework | How you get it |
|---|---|
| React | ref with the ChartHandle type |
| Vue | A template ref, InstanceType<typeof SpLineChart> |
| Angular | viewChild.required<SpLineChart>('chart'); the component has both methods |
| Reflex | get_svg and download_svg, which call it in the browser |
A download button in React
The starting point is the React application from article 03, with the hourly rows in src/traffic.ts. One function downloads a text as a file: it creates a Blob, gives it a temporary URL and clicks a link with download. src/download.ts:
export function downloadSvg(svg: string, filename: string) {
  const url = URL.createObjectURL(new Blob([svg], { type: 'image/svg+xml' }));
  const link = document.createElement('a');
  link.href = url;
  link.download = filename;
  link.click();
  URL.revokeObjectURL(url);
}
And the page, src/App.tsx:
import { useRef } from 'react';
import { LineChart, type ChartHandle } from '@silverpoint/react/line-chart';
import { downloadSvg } from './download';
import { traffic } from './traffic';

export default function App() {
  const chart = useRef<ChartHandle>(null);

  const exportChart = () => {
    const svg = chart.current?.toSVGString();
    if (svg) downloadSvg(svg, 'hits-per-hour.svg');
  };

  return (
    <main style={{ maxWidth: 640 }}>
      <LineChart
        ref={chart}
        id="hits"
        data={traffic}
        xKey="hour"
        valueKey="hits"
        title="Hits per hour"
        badge="Today"
        height={200}
      />
      <button type="button" onClick={exportChart}>
        Download SVG
      </button>
    </main>
  );
}
ref={chart} leaves the handle in chart.current. When you press "Download SVG", the browser saves hits-per-hour.svg.
The problem: the file comes out black
Open that file in the browser, without the application, and you will see a black block with system lettering. On the left of the image is that file; on the right, the same one after the fix in the next section:
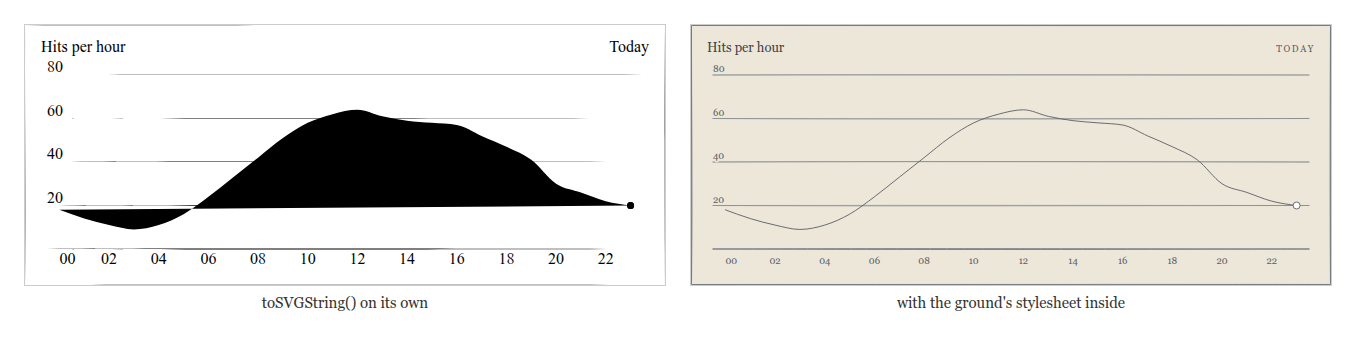
The reason is in what it contains. The SVG carries no colours: every stroke has a part attribute and the colours come from the ground's stylesheet, @silverpoint/grounds/styles.css, through CSS variables. On the page that stylesheet is loaded. Outside it, the SVG falls back to the browser's defaults: black fill and the system font.
toSVGString() returns that markup as it is, without the stylesheet, in React, Vue and Angular: I checked it in the three with silverpoint 0.10.1, and the file comes out just as black in all of them. It is so on purpose, because it is the chart's canonical markup. What changed in 0.10.0 is that the library now ships the function that adds the stylesheet (silverpoint#14).
The fix: the stylesheet inside the SVG
The ground's stylesheet is prepared for this: its rules also apply to a standalone <svg>, with no page around it. All it takes is putting it inside the SVG itself, right after the opening tag. Since 0.10.0, standaloneSVG, from @silverpoint/grounds, does it. The download function calls it before creating the Blob. src/download.ts ends up like this:
import { standaloneSVG } from '@silverpoint/grounds';
import groundCss from '@silverpoint/grounds/styles-text';

export function downloadSvg(svg: string, filename: string) {
  const file = new Blob([standaloneSVG(svg, groundCss)], { type: 'image/svg+xml' });
  const url = URL.createObjectURL(file);
  const link = document.createElement('a');
  link.href = url;
  link.download = filename;
  link.click();
  URL.revokeObjectURL(url);
}
Two details:
@silverpoint/grounds/styles-textis thestyles.cssstylesheet as a JavaScript module that exports its text. It is imported the same way in any bundler, with no?rawand no configuration. The stylesheet takes about 11.7 kB and ends up inside the application's bundle.<![CDATA[…]]>is required, andstandaloneSVGwrites it. The stylesheet has a comment that contains<svg>, and withoutCDATAthe file stops being valid XML: the browser shows an error instead of the chart.
App.tsx does not change. Now the downloaded file, opened on its own, looks like the right half of the image. It is the same thing the render_chart tool of the silverpoint MCP server does, which we will see in article 28: it puts the ground's stylesheet on the root <svg>.
What the SVG contains
These are the parts of the file, opened in an editor:
| Part | What it is |
|---|---|
<svg viewBox width height> | The size measured on the page: 640 × 260 px here, 200 of drawing area plus the card |
class and data-substrate | The ground and the substrate, sp-ground-silverpoint and cream |
role="img" and aria-labelledby | The accessible name, which points to <title> and <desc> |
<title> and <desc> | The title and the description the chart generates from its data |
<defs> | The hatching patterns |
<path part data-role> | The strokes: the frame, the grid, the line and its points |
<text part> | The text: title, badge and axis ticks |
<style> | The ground's stylesheet, added by standaloneSVG |
It is the whole card, with the title, the "Today" badge and the frame.
And this is what it does not carry:
- The data table. The table hidden for screen readers is outside the SVG. The file keeps the name and the description.
- The font. The lettering asks for EB Garamond. If the computer that opens the file does not have it, it uses the next one in the list: Iowan Old Style or Georgia.
- The entry animation. It lives in the stylesheet, so the file replays it when it opens. If you take a screenshot right after opening it, it may come out half drawn.
A palette of your own does travel. If the chart has palette, or gets one from the provider, the SVG writes it as variables in the root's style attribute, and the ground's stylesheet uses them.
The file's size is the chart's size on the page. If you want another size in the file, set width and height on the chart. With the fix, this example's file goes from 4.5 kB to 16.2 kB.
In Vue
The same button, with a template ref. src/download.ts is the React one. src/App.vue:
<script setup lang="ts">
import { ref } from 'vue';
import { SpLineChart } from '@silverpoint/vue/line-chart';
import { downloadSvg } from './download';
import { traffic } from './traffic';

const chart = ref<InstanceType<typeof SpLineChart>>();

function exportChart() {
  const svg = chart.value?.toSVGString();
  if (svg) downloadSvg(svg, 'hits-per-hour.svg');
}
</script>

<template>
  <main style="max-width: 640px">
    <SpLineChart
      ref="chart"
      id="hits"
      :data="traffic"
      x-key="hour"
      value-key="hits"
      title="Hits per hour"
      badge="Today"
      :height="200"
    />
    <button type="button" @click="exportChart">Download SVG</button>
  </main>
</template>
ref="chart" binds the chart ref to the component, and InstanceType<typeof SpLineChart> gives it the type with toSVGString().
In Angular
src/app/download.ts is the React one, unchanged. @silverpoint/grounds/styles-text is a plain JavaScript module: Angular imports it with no import attributes, no TypeScript declarations and no change to angular.json, with ng serve and with ng build alike.
Up to 0.9.2 you had to import styles.css with loader: 'text', declare its type and turn off the prebundling of ng serve, which left the page blank (silverpoint#19). And the component, src/app/app.ts:
import { Component, viewChild } from '@angular/core';
import { SpLineChart } from '@silverpoint/angular/line-chart';
import { downloadSvg } from './download';
import { traffic } from './traffic';

@Component({
  selector: 'app-root',
  imports: [SpLineChart],
  template: `
    <main style="max-width: 640px">
      <sp-line-chart
        #chart
        id="hits"
        [data]="traffic"
        xKey="hour"
        valueKey="hits"
        title="Hits per hour"
        badge="Today"
        [height]="200"
      />
      <button type="button" (click)="exportChart()">Download SVG</button>
    </main>
  `,
})
export class App {
  protected readonly traffic = traffic;
  private readonly chart = viewChild.required<SpLineChart>('chart');

  protected exportChart() {
    downloadSvg(this.chart().toSVGString(), 'hits-per-hour.svg');
  }
}
#chart marks the chart, and viewChild.required returns it as SpLineChart, the component with toSVGString() and getGeometry().
In Reflex
Reflex brings two helpers for this in reflex_silverpoint_react:
| Function | What it does |
|---|---|
download_svg(id, filename) | Calls toSVGString() in the browser and downloads the file |
get_svg(id, handler) | Calls toSVGString() and sends the text to a backend event |
Both find the chart by its id, so the chart needs one. download_svg is the shortest:
import reflex as rx
from reflex_silverpoint_react import download_svg, line_chart

from .traffic import TRAFFIC


def index() -> rx.Component:
    return rx.box(
        line_chart(
            id="hits",
            data=TRAFFIC,
            x_key="hour",
            value_key="hits",
            title="Hits per hour",
            badge="Today",
            height=200,
        ),
        rx.el.button(
            "Download SVG",
            type="button",
            on_click=download_svg("hits", "hits-per-hour.svg"),
        ),
        max_width="640px",
        padding="32px",
    )


app = rx.App()
app.add_page(index)
Since reflex-silverpoint-react 0.10.0, download_svg delivers the complete file: it puts inside the SVG, in CDATA, the silverpoint rules the page has, and the file shows its colours outside the application (reflex-silverpoint-react#45). Nothing goes through the backend. get_svg hands that same SVG to an event, for when you want to do something with it in Python.
Up to 0.9.1, the file came out without the stylesheet, black as in the other three, and you had to send it to the backend with get_svg to insert it.
One size difference: in Reflex the chart is 576 px wide, because max_width="640px" includes the 32 px of padding on each side. The file comes out at 576 × 260.
The four files were checked with headless Chrome: React, Vue and Angular download exactly the same bytes, and the Reflex one is the same chart at 576 px, with the rules taken from the page. Opened on their own, they look as they do on the page; without the stylesheet, they look black.
Without a browser
toSVGString() needs the chart mounted on a page. To generate SVG on a server or in a script there are two paths: React's server charts, which are the subject of the next article, and the render_chart tool of the MCP server. Internally, the adapters use functions from the @silverpoint/grounds package that also work without a DOM, but the specification does not include them in the public API: they may change without notice.
Common problems
- The file looks black. It is missing the ground's stylesheet. Add it with
standaloneSVG. - The browser shows an XML error when opening it. The stylesheet is inside
<style>withoutCDATA.standaloneSVGalready writes it. toSVGStringisundefined. The handle does not exist yet: the chart has not mounted, or in Reflex theidinget_svgdoes not match the chart's.TS2307in Angular, or a blank page withng serve.styles.csswas imported withloader: 'text'. Import the stylesheet from@silverpoint/grounds/styles-text(silverpoint#19).- The lettering changes shape on another computer. The SVG does not carry the font. If the shape of the letters matters, convert the file to PNG or PDF on a computer that has EB Garamond.
What comes next
Article 19 takes the drawing to the server: React's server charts, rendering in Vue and Angular, and why the same id gives the same drawing on the server and in the browser.
The export guide in the documentation describes each framework's handle.