A silverpoint chart looks hand-drawn: the lines tremble a little and the frame is not a perfect rectangle. If that tremble were random, the server would draw one chart and the browser another, and the page would show a jump on load or a hydration error.
This article in the series on silverpoint explains why that does not happen, and how to render the operations panel on the server with Next.js, Vue and Angular. Also what Reflex does.
The tremble comes from a seed
The hand-drawn stroke does not use Math.random(). It comes from a seed, and the seed comes from the chart's id. Article 07 introduced it among the common props:
| Prop | What it does | Default |
|---|---|---|
id | A stable identifier | One generated deterministically |
seed | The seed of the hand-drawn stroke | Derived from id |
The library's specification sets it down in four rules:
- The seed is derived from the
idin a stable way. - The drawing code cannot call
Math.random()orDate.now(). A check in continuous integration prevents it. - The same inputs give the same SVG, byte for byte.
- Coordinates are rounded to two decimals, so that two JavaScript engines do not differ in the last digit.
The consequence is what matters here: the same id, with the same data and the same size, gives the same strokes on the server and in the browser, and on every run. The server sends an SVG, the browser draws an identical one on top and there is nothing to correct.
React's server charts
In React, every chart has two entries:
| Entry | What it is |
|---|---|
@silverpoint/react/line-chart | The client component: it measures its container, responds to the pointer and the keyboard |
@silverpoint/react/server/line-chart | A server component: pure SVG, no JavaScript in the browser |
The server one measures nothing, because on the server there is no container. That is why it needs three props the client one does not require: id, width and height. If one is missing, the chart warns with SP002 or SP003. It does not accept events either: there is no JavaScript to listen to them.
A server chart in Next.js
A new Next.js application with the App Router:
npx create-next-app@latest ops-panel
cd ops-panel
npm install @silverpoint/react @silverpoint/grounds @silverpoint/fonts
The hourly rows from article 03 go in app/traffic.ts. The stylesheets are loaded once, in app/layout.tsx:
import type { Metadata } from 'next';
import '@silverpoint/fonts/fonts.css';
import '@silverpoint/grounds/styles.css';
import './globals.css';

export const metadata: Metadata = {
  title: 'Operations panel',
};

export default function RootLayout({ children }: { children: React.ReactNode }) {
  return (
    <html lang="en">
      <body>{children}</body>
    </html>
  );
}
app/globals.css sets the background and the margin:
body {
  margin: 0;
  padding: 32px;
  background: #f4f1ea;
}
And the page, app/page.tsx, which is a server component:
import { LineChart } from '@silverpoint/react/server/line-chart';
import { traffic } from './traffic';

export default function Page() {
  return (
    <main>
      <LineChart
        id="hits"
        width={640}
        height={200}
        data={traffic}
        xKey="hour"
        valueKey="hits"
        title="Hits per hour"
        badge="Today"
      />
    </main>
  );
}
With npm run build, Next.js treats the page as static and saves its HTML. That HTML already contains the whole chart: the SVG with its strokes, the hidden data table and data-status="ready". The page does not load a single line of silverpoint JavaScript in the browser.
I compared that page's SVG with the one toSVGString() exports in the browser, with the Vite application from article 18 and the same id, width and height. They are identical, byte for byte: Node and Chrome draw the same strokes.
A dashboard on the server
The Dashboard from article 13 also has its server entry, @silverpoint/react/server/dashboard. The rows gain the errors field, in app/ops.ts:
export type HourlyOps = {
  hour: string;
  hits: number;
  errors: number;
};

export const ops: HourlyOps[] = [
  { hour: '00', hits: 18, errors: 2 },
  { hour: '01', hits: 14, errors: 1 },
  { hour: '02', hits: 11, errors: 1 },
  { hour: '03', hits: 9, errors: 0 },
  { hour: '04', hits: 11, errors: 1 },
  { hour: '05', hits: 16, errors: 1 },
  { hour: '06', hits: 24, errors: 2 },
  { hour: '07', hits: 33, errors: 4 },
  { hour: '08', hits: 42, errors: 6 },
  { hour: '09', hits: 51, errors: 7 },
  { hour: '10', hits: 58, errors: 9 },
  { hour: '11', hits: 62, errors: 8 },
  { hour: '12', hits: 64, errors: 11 },
  { hour: '13', hits: 61, errors: 9 },
  { hour: '14', hits: 59, errors: 7 },
  { hour: '15', hits: 58, errors: 6 },
  { hour: '16', hits: 57, errors: 6 },
  { hour: '17', hits: 52, errors: 5 },
  { hour: '18', hits: 47, errors: 4 },
  { hour: '19', hits: 41, errors: 4 },
  { hour: '20', hits: 30, errors: 3 },
  { hour: '21', hits: 26, errors: 2 },
  { hour: '22', hits: 22, errors: 2 },
  { hour: '23', hits: 20, errors: 2 },
];app/panel/page.tsx:
import { BarChart } from '@silverpoint/react/server/bar-chart';
import { Dashboard, DashboardCell, type DashboardLayout } from '@silverpoint/react/server/dashboard';
import { LineChart } from '@silverpoint/react/server/line-chart';
import { ops } from '../ops';

const layout: DashboardLayout = {
  columns: { sm: 1, md: 2, lg: 3 },
  cells: [{ id: 'hits', colSpan: { md: 2, lg: 2 } }, { id: 'errors' }],
};

export default function PanelPage() {
  return (
    <Dashboard id="ops" title="Operations" layout={layout} ssrWidth={1200}>
      <DashboardCell cell="hits">
        <LineChart data={ops} xKey="hour" valueKey="hits" title="Hits per hour" />
      </DashboardCell>
      <DashboardCell cell="errors">
        <BarChart data={ops} xKey="hour" valueKey="errors" title="Errors per hour" />
      </DashboardCell>
    </Dashboard>
  );
}
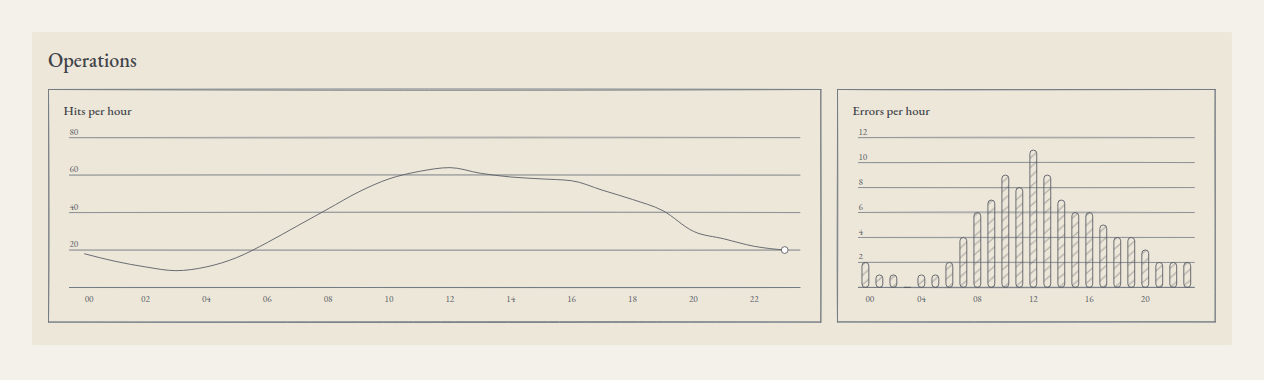
Here the charts carry no id, width or height. The dashboard provides them: each chart gets its cell's id, ops--hits and ops--errors, and the cell's size. It is the image above.
The server does not know the window's width, so the dashboard assumes one: ssrWidth, 1200 px by default. At 1200 px the dashboard is at the lg size, with three columns, and the server draws the traffic at 794.67 px and the errors at 389.33 px.
A server dashboard has no link: linked charts need JavaScript in the browser. If you want to link them, use the client Dashboard.
Client charts in Next.js
An interactive chart is a client component. It goes in its own file with 'use client', app/live/hits-chart.tsx:
'use client';

import { useState } from 'react';
import type { ActiveItem } from '@silverpoint/core';
import { LineChart } from '@silverpoint/react/line-chart';
import { traffic } from '../traffic';

export function HitsChart() {
  const [active, setActive] = useState<ActiveItem | null>(null);

  return (
    <>
      <LineChart
        id="hits"
        data={traffic}
        xKey="hour"
        valueKey="hits"
        title="Hits per hour"
        badge="Today"
        height={200}
        onActiveChange={setActive}
      />
      <p>{active ? `${String(active.datum.hour)}:00, ${active.value}k hits` : 'Point at an hour'}</p>
    </>
  );
}
And the page that uses it, app/live/page.tsx, is still a server one:
import { HitsChart } from './hits-chart';

export default function LivePage() {
  return (
    <main style={{ maxWidth: 640 }}>
      <HitsChart />
    </main>
  );
}
Next.js also renders this chart on the server, but without width it does not know its size. The HTML carries a placeholder with data-status="deferred" and an empty SVG. In the browser, the chart measures its container and draws: 640 × 260 px, with no errors in the console, and when the pointer moves over it the text changes to "11:00, 62k hits".
If you want the drawing in the HTML for a client chart too, give it id and width. With both fixed, the server's strokes and the browser's match.
What breaks determinism
I tried three variants of the client chart with next dev:
id | Result |
|---|---|
id="hits" | The same strokes on the server and in the browser, no warnings |
id={`hits-${Math.random().toString(36).slice(2)}`} | Next.js warns about an unstable Math.random() value and React about attributes that do not match on hydration; 6 of the 9 strokes change |
No id | The chart uses React's useId and generates the same id on both sides |
An id with Math.random() or Date.now() gives a different seed on every render: the server and the browser draw two different charts. React's warning says it plainly: those differences are not patched up, and the page is left with attributes from one render and the other mixed together.
Without an id it works, but the generated id depends on the chart's position in the component tree. If you move the chart, its drawing changes. An explicit, stable id is the safest choice.
In Vue
Vue renders on the server with createSSRApp and renderToString. On top of the Vite application from article 04, src/App.vue:
<script setup lang="ts">
import { SpLineChart } from '@silverpoint/vue/line-chart';
import { traffic } from './traffic';
</script>

<template>
  <main style="max-width: 640px">
    <SpLineChart
      id="hits"
      :width="640"
      :data="traffic"
      x-key="hour"
      value-key="hits"
      title="Hits per hour"
      badge="Today"
      :height="200"
    />
  </main>
</template>
The server entry, src/entry-server.ts, installs the provider with the language for numbers, as in article 09:
import { createSSRApp } from 'vue';
import { renderToString } from 'vue/server-renderer';
import { provideSilverpoint } from '@silverpoint/vue';
import App from './App.vue';

export function render(): Promise<string> {
  return renderToString(createSSRApp(App).use(provideSilverpoint({ locale: 'en' })));
}
To try it, Vite compiles it for Node and a script runs it. render.mjs:
import { render } from './dist-server/entry-server.js';

console.log(await render());
npx vite build --ssr src/entry-server.ts --outDir dist-server
node render.mjsOut comes the chart's HTML with data-status="ready" and a 640 × 260 px SVG. Its strokes are the same as those of React's server chart and those in the browser. Two runs give exactly the same HTML.
As in React, without width the chart comes out in the deferred state, with no strokes, and is drawn when it mounts in the browser. Nuxt uses this same mechanism, but the silverpoint documentation does not list it as a validated integration.
In Angular
In Angular there is nothing silverpoint-specific. On top of the application from article 05:
npx ng add @angular/ssrThe command creates src/server.ts and src/main.server.ts, sets "outputMode": "server" in angular.json and adds provideClientHydration() to the configuration. By default, every route is prerendered at build time. src/app/app.ts:
import { Component } from '@angular/core';
import { SpLineChart } from '@silverpoint/angular/line-chart';
import { traffic } from './traffic';

@Component({
  selector: 'app-root',
  imports: [SpLineChart],
  template: `
    <main style="max-width: 640px">
      <sp-line-chart
        id="hits"
        [width]="640"
        [data]="traffic"
        xKey="hour"
        valueKey="hits"
        title="Hits per hour"
        badge="Today"
        [height]="200"
      />
    </main>
  `,
})
export class App {
  protected readonly traffic = traffic;
}
ng build prerenders the route and leaves the HTML in dist/ops-panel/browser/index.html. The chart is inside, ready, with the same strokes as in React and Vue. Without [width], it comes out deferred, as in the other two.
In Angular, an id written as an attribute also stays on the sp-line-chart element. The chart's inner elements carry the id with a suffix, such as hits-title or hits-desc, so they do not repeat it.
To serve it:
NG_ALLOWED_HOSTS=localhost node dist/ops-panel/server/server.mjsWithout NG_ALLOWED_HOSTS, Angular's server answers localhost with a 400 error: as a protection, it only serves the host names it knows. In production, put your domain. In the browser, the page hydrates with the chart ready and no errors in the console.
In Reflex
Reflex compiles pages to a React application, and reflex export --frontend-only generates a static version: this blog is published that way. The silverpoint documentation says that in Reflex charts are drawn on the client. The export, however, prerenders every page to HTML, and the chart behaves like a React client chart in Next.js.
With the chart from article 06, without width, the exported HTML carries the chart in deferred and an empty SVG. With id and width, ops_panel/ops_panel.py:
import reflex as rx
from reflex_silverpoint_react import line_chart

from .traffic import TRAFFIC


def index() -> rx.Component:
    return rx.box(
        line_chart(
            id="hits",
            width=640,
            data=TRAFFIC,
            x_key="hour",
            value_key="hits",
            title="Hits per hour",
            badge="Today",
            height=200,
        ),
        max_width="704px",
        padding="32px",
    )


app = rx.App()
app.add_page(index)
max_width goes up to 704 px so that the chart's 640 px and the 32 px of padding on each side fit. The exported index.html already contains the chart ready, with the same strokes as in React, Vue and Angular. Served as static files, with no backend, the chart looks the same. The console only complains that it cannot open the backend's WebSocket, which is expected without one.
In Reflex determinism also shows beyond the first render: a chart that mounts again with the same data is drawn the same way, because its id does not change.
Common problems
SP002orSP003on a server chart. It is missingid,widthorheight. Inside a serverDashboard, the dashboard sets them.- A hydration warning in Next.js. Something in the
idchanges between the server and the browser:Math.random(),Date.now()or a value that only exists on one of the two. - The HTML has
data-status="deferred"and no strokes. The chart had nowidthon the server. That is correct: it is drawn in the browser. If you want it in the HTML, setwidth. - A 400 when serving Angular locally.
NG_ALLOWED_HOSTSis missing. - The server dashboard is drawn at another width. It uses
ssrWidth, not the window's real width.
What comes next
Article 20 feeds the panel with live data and deals with performance.
The server rendering guide in the documentation sums up each framework's case.