Articles 03 to 06 drew the same line chart in four frameworks. This one closes level 1 of the series on silverpoint with what those charts have in common: a set of props that any of the 60 charts accepts, from the bar chart to the sunburst.
Learning them once serves for all of them. What changes from one chart to another is its accessors, the props that say which field of each row to draw (xKey and valueKey in the line chart), and its own options. Each catalog article will cover those.
The same prop in four syntaxes
The props have the same names in the four adapters. Only the way they are written changes:
| Framework | Literal text | Expression |
|---|---|---|
| React | footerLeft="Last 24 hours" | height={200} |
| Vue | footer-left="Last 24 hours" | :height="200" |
| Angular | footerLeft="Last 24 hours" | [height]="200" |
| Reflex | footer_left="Last 24 hours" | height=200 |
A number, an object or a variable always go as an expression. In Vue and Angular, if you write height="200" without : or without brackets, the chart receives the text "200" and type checking fails.
The tables in this article use the React name. In Vue it becomes kebab-case (data-table), in Angular it is the same and in Reflex it becomes snake_case (data_table).
The data
| Prop | What it does |
|---|---|
data | The rows that are drawn, an array of objects |
Without data, the chart draws its demo set, and with an empty array it draws its empty state, "No data". Each chart's accessors (xKey, valueKey, keys…) are ignored with the demo data; the other props apply.
The style
| Prop | Values | Default |
|---|---|---|
ground | silverpoint, cyanotype | silverpoint, or the application provider's |
substrate | cream, green, blue, ochre in silverpoint; prussian in cyanotype | The ground's first |
mode | ink, precision | ink |
palette | An object with the colours you replace | The ground's |
The ground and the substrate are the ideas from articles 01 and 02: the set of drawing decisions and the prepared paper. mode="precision" turns off the hand inking and leaves the strokes exact. Palettes and their contrast check have their own article.
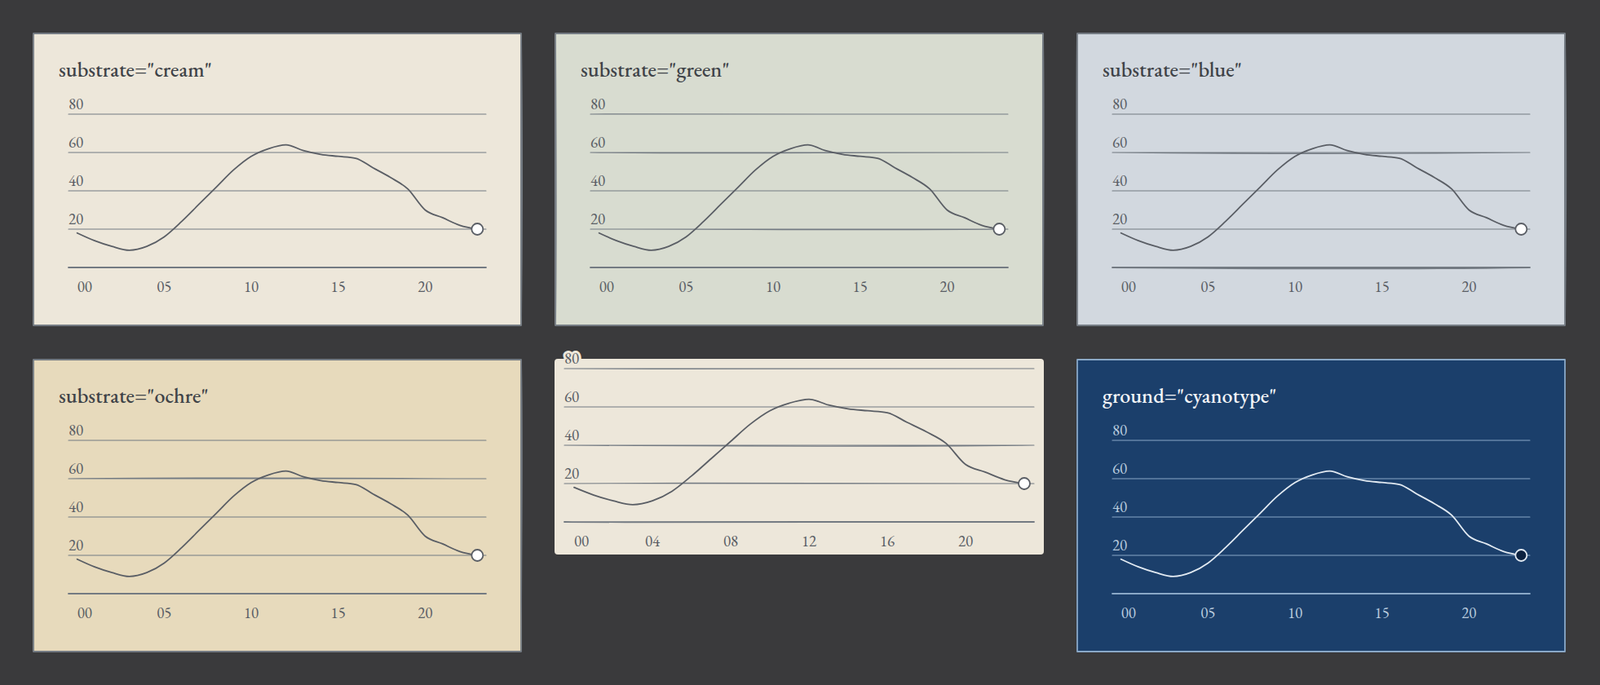
It is the same chart six times. At the top and bottom left, the four substrates of the silverpoint ground. Bottom centre, with chrome="bare". Bottom right, with ground="cyanotype": white lines on Prussian blue.
The size and the card
| Prop | What it does | Default |
|---|---|---|
height | The height of the drawing area in pixels | 160 |
width | A fixed width in pixels | The container's |
chrome | card draws the full card; bare, only the drawing area | card |
Normally width is not set: the chart measures its container and redraws when it changes. That is why a container with no width leaves the chart undrawn.
With chrome="bare" the whole frame disappears, title included: it is for when the chart goes inside another card or a panel that already has its own.
The card text
| Prop | Where it appears |
|---|---|
title | The title, top left |
badge | A short label, top right |
value | The highlighted value, below the title |
unit | The unit, next to the value |
footerLeft | The footer, on the left |
footerRight | The footer, on the right |
value accepts a number or a text. If it is a number, it is formatted with locale and numberFormat, like the axes.
Accessibility
| Prop | What it does | Default |
|---|---|---|
label | The chart's accessible name | The title |
description | The long description for screen readers | One the chart generates from its data |
dataTable | The table with the data: visible, hidden or none | hidden |
Each chart is an SVG with its name and its description, and carries a table with the same data next to it. With hidden, the table exists for assistive technologies but is not seen. With visible, it appears below the chart. With none, it is not generated; use it only if the page already offers the data in another form.
Numbers
| Prop | What it does |
|---|---|
locale | The language and region of the numbers, such as es-ES or en-US |
numberFormat | The Intl.NumberFormat options |
Both apply to everything the chart shows: the highlighted value, the axis ticks and the data table. With locale="es-ES" and { notation: 'compact' }, 63844 is written "64 mil".
The drawing
| Prop | What it does | Default |
|---|---|---|
id | A stable identifier | One generated deterministically |
seed | The seed of the hand stroke | Derived from id |
hatchFill | How areas are filled: tile or per-shape | tile |
className | A CSS class for the chart's root | None |
The hand stroke is not random on each render: it comes from the seed. The same chart with the same id is always drawn the same way, on the server and in the browser. If two charts with the same data must look different, give them different seeds. In Reflex it is written class_name, as in any Reflex component.
The events, onActiveChange and onSelect, are common too, but they have their own article: 11, on interaction.
All together
The operations panel's requests per hour, now without turning them into thousands, on the green substrate, with the data table visible and the numbers in compact Spanish. The data are rows such as { hour: '12', requests: 63844 }.
In React:
<main style={{ maxWidth: 640 }}>
  <LineChart
    data={requests}
    xKey="hour"
    valueKey="requests"
    substrate="green"
    height={200}
    title="Requests per hour"
    badge="Today"
    value={63844}
    unit="requests at the peak"
    footerLeft="Last 24 hours"
    footerRight="Peak at 12:00"
    description="Requests to the web service per hour over the last 24 hours."
    dataTable="visible"
    locale="es-ES"
    numberFormat={{ notation: 'compact' }}
  />
</main>
In Vue:
<main style="max-width: 640px">
  <SpLineChart
    :data="requests"
    x-key="hour"
    value-key="requests"
    substrate="green"
    :height="200"
    title="Requests per hour"
    badge="Today"
    :value="63844"
    unit="requests at the peak"
    footer-left="Last 24 hours"
    footer-right="Peak at 12:00"
    description="Requests to the web service per hour over the last 24 hours."
    data-table="visible"
    locale="es-ES"
    :number-format="{ notation: 'compact' }"
  />
</main>
In Angular:
<main style="max-width: 640px">
  <sp-line-chart
    [data]="requests"
    xKey="hour"
    valueKey="requests"
    substrate="green"
    [height]="200"
    title="Requests per hour"
    badge="Today"
    [value]="63844"
    unit="requests at the peak"
    footerLeft="Last 24 hours"
    footerRight="Peak at 12:00"
    description="Requests to the web service per hour over the last 24 hours."
    dataTable="visible"
    locale="es-ES"
    [numberFormat]="{ notation: 'compact' }"
  />
</main>
And in Reflex:
rx.box(
    line_chart(
        data=REQUESTS,
        x_key="hour",
        value_key="requests",
        substrate="green",
        height=200,
        title="Requests per hour",
        badge="Today",
        value=63844,
        unit="requests at the peak",
        footer_left="Last 24 hours",
        footer_right="Peak at 12:00",
        description="Requests to the web service per hour over the last 24 hours.",
        data_table="visible",
        locale="es-ES",
        number_format={"notation": "compact"},
    ),
    max_width="640px",
)
All four draw the same chart: "64 mil" as the highlighted value, ticks such as "20 mil" and "40 mil" on the axis and the 24-row table below. The description replaces the one the chart generates.
What comes next
This article ends level 1. You now know how to install silverpoint in your framework, pass it your data and configure any chart with the common props.
Level 2 builds a panel with its own style and interaction. It starts with 08: how to choose the chart among the catalog's families. The props reference in the documentation has the full list for each chart.