Until now every article in the series on silverpoint drew separate charts. This one brings them together in the operations panel: two indicators, traffic per hour, errors per hour, errors per day and sales by channel, in a grid that adapts to the available width.
The piece is Dashboard. It has no coordinates and no dragging: the layout is a data object that says how many columns there are at each size and how many columns and rows each cell takes. The charts are its children, and each one gets its width and height from its cell.
What you will build
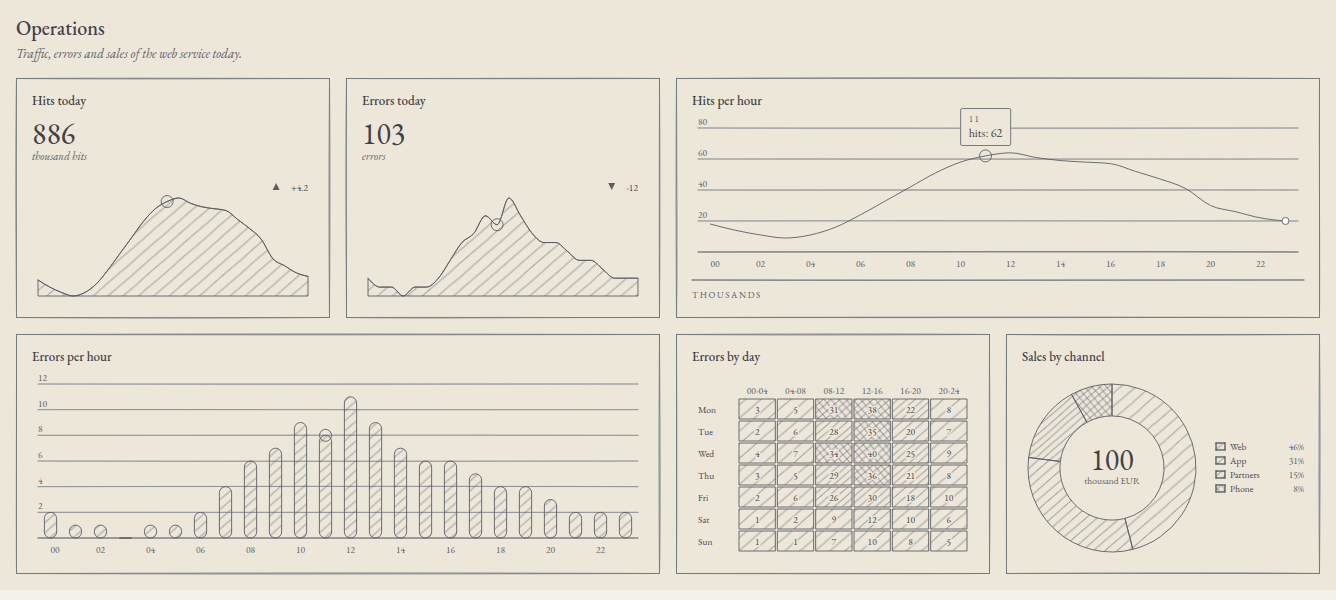
On a desktop screen the panel has four columns. On a tablet it drops to two and on a phone to one, without changing the reading order. When the pointer passes over hour 11 of the traffic, the same hour is marked in the errors per hour and in the two indicators.
The data
The hourly rows from the previous articles gain a field, errors. With them come the panel's two new tables: errors by day and four-hour block, and sales by channel in thousands of euros. In React and Vue this file is src/ops.ts; in Angular, src/app/ops.ts:
export type HourRow = { hour: string; hits: number; errors: number };
export type DayRow = { day: string; values: number[] };
export type ChannelRow = { channel: string; sales: number };

export const hourly: HourRow[] = [
  { hour: '00', hits: 18, errors: 2 },
  { hour: '01', hits: 14, errors: 1 },
  { hour: '02', hits: 11, errors: 1 },
  { hour: '03', hits: 9, errors: 0 },
  { hour: '04', hits: 11, errors: 1 },
  { hour: '05', hits: 16, errors: 1 },
  { hour: '06', hits: 24, errors: 2 },
  { hour: '07', hits: 33, errors: 4 },
  { hour: '08', hits: 42, errors: 6 },
  { hour: '09', hits: 51, errors: 7 },
  { hour: '10', hits: 58, errors: 9 },
  { hour: '11', hits: 62, errors: 8 },
  { hour: '12', hits: 64, errors: 11 },
  { hour: '13', hits: 61, errors: 9 },
  { hour: '14', hits: 59, errors: 7 },
  { hour: '15', hits: 58, errors: 6 },
  { hour: '16', hits: 57, errors: 6 },
  { hour: '17', hits: 52, errors: 5 },
  { hour: '18', hits: 47, errors: 4 },
  { hour: '19', hits: 41, errors: 4 },
  { hour: '20', hits: 30, errors: 3 },
  { hour: '21', hits: 26, errors: 2 },
  { hour: '22', hits: 22, errors: 2 },
  { hour: '23', hits: 20, errors: 2 },
];

export const errorsByDay: DayRow[] = [
  { day: 'Mon', values: [3, 5, 31, 38, 22, 8] },
  { day: 'Tue', values: [2, 6, 28, 35, 20, 7] },
  { day: 'Wed', values: [4, 7, 34, 40, 25, 9] },
  { day: 'Thu', values: [3, 5, 29, 36, 21, 8] },
  { day: 'Fri', values: [2, 6, 26, 30, 18, 10] },
  { day: 'Sat', values: [1, 2, 9, 12, 10, 6] },
  { day: 'Sun', values: [1, 1, 7, 10, 8, 5] },
];

export const blocks = ['00-04', '04-08', '08-12', '12-16', '16-20', '20-24'];

export const sales: ChannelRow[] = [
  { channel: 'Web', sales: 46 },
  { channel: 'App', sales: 31 },
  { channel: 'Partners', sales: 15 },
  { channel: 'Phone', sales: 8 },
];
The panel in React
Replace src/App.tsx:
import { useState } from 'react';
import { BarChart } from '@silverpoint/react/bar-chart';
import { Dashboard, DashboardCell, type DashboardLayout } from '@silverpoint/react/dashboard';
import { DonutChart } from '@silverpoint/react/donut-chart';
import { HeatmapChart } from '@silverpoint/react/heatmap-chart';
import { KpiCard } from '@silverpoint/react/kpi-card';
import { LineChart } from '@silverpoint/react/line-chart';
import { blocks, errorsByDay, hourly, sales } from './ops';

const layout: DashboardLayout = {
  columns: { sm: 1, md: 2, lg: 4 },
  rowHeight: 240,
  gap: 16,
  cells: [
    { id: 'hits-today' },
    { id: 'errors-today' },
    { id: 'traffic', colSpan: { md: 2, lg: 2 } },
    { id: 'errors-hour', colSpan: { md: 2, lg: 2 } },
    { id: 'errors-day' },
    { id: 'channels' },
  ],
};

export default function App() {
  const [linked, setLinked] = useState('—');

  return (
    <main>
      <Dashboard
        id="ops"
        title="Operations"
        description="Traffic, errors and sales of the web service today."
        layout={layout}
        link={{ key: 'hour' }}
        onLinkChange={(link) => setLinked(link?.value == null ? '—' : `${link.key} ${String(link.value)}`)}
      >
        <DashboardCell cell="hits-today">
          <KpiCard title="Hits today" data={hourly} valueKey="hits" value={886} unit="thousand hits" delta={4.2} />
        </DashboardCell>
        <DashboardCell cell="errors-today">
          <KpiCard title="Errors today" data={hourly} valueKey="errors" value={103} unit="errors" delta={-12} />
        </DashboardCell>
        <DashboardCell cell="traffic">
          <LineChart title="Hits per hour" data={hourly} xKey="hour" valueKey="hits" footerLeft="Thousands" />
        </DashboardCell>
        <DashboardCell cell="errors-hour">
          <BarChart title="Errors per hour" data={hourly} xKey="hour" valueKey="errors" />
        </DashboardCell>
        <DashboardCell cell="errors-day">
          <HeatmapChart
            title="Errors by day"
            data={errorsByDay}
            labelKey="day"
            valuesKey="values"
            columnLabels={blocks}
            scaleMax={40}
          />
        </DashboardCell>
        <DashboardCell cell="channels">
          <DonutChart title="Sales by channel" data={sales} nameKey="channel" valueKey="sales" centerLabel="thousand EUR" />
        </DashboardCell>
      </Dashboard>
      <p>Linked: {linked}</p>
    </main>
  );
}
With npm run dev you will see the panel in the image. The rest of the article explains its pieces.
The panel and its name
Dashboard needs two things: an id and a name, title or label. In React and Vue, the type does not let you leave them out.
| Prop | What it does | Default |
|---|---|---|
id | The panel's stable identifier | Required |
title | The visible title, which also names the region | title or label, required |
label | The accessible name, when you do not want a visible title | |
description | A long description of the region | |
headingLevel | The heading level of the title | 2 |
layout | The layout, as data | One cell per child |
link | The field that links the charts | No link |
ssrWidth | The width assumed when rendering on the server | 1200 |
The panel is drawn as a <section> with an <h2> that names it. Every chart without its own id gets one derived from the panel and its cell: the errors per hour chart is ops--errors-hour. Since the hand-drawn stroke comes from that seed, a stable id for the panel keeps the drawing of all its charts stable.
The layout is data
layout is an object with no functions or components, which can be stored in a JSON file or sent from a server:
| Field | What it does | Default |
|---|---|---|
columns | The columns at each size | { sm: 1, md: 2, lg: 4 } |
rowHeight | The height of a row in pixels, card frame included | 240 |
gap | The space between cells in pixels | 16 |
cells | The cells, in reading order | One single-column cell per child |
And each cell:
| Field | What it does | Default |
|---|---|---|
id | The name DashboardCell uses | Required |
colSpan | The columns it takes | 1 |
rowSpan | The rows it takes | 1 |
The sizes do not depend on the browser window but on the width of the panel itself. A panel inside a sidebar is narrow even if the screen is large.
| Size | Panel width | Columns in this panel |
|---|---|---|
sm | Under 640 px | 1 |
md | 640 to 1023 px | 2 |
lg | 1024 px or more | 4 |
colSpan and rowSpan accept a number, which applies to all three sizes, or an object per size. The traffic and the errors per hour take { md: 2, lg: 2 }: two columns on a tablet and on a desktop, and one on a phone, where there are no more. If you write a bare colSpan: 2, at sm the cell asks for two columns where there is only one: the panel trims it to one and, in development, warns with SP014.
These are the cells measured in the browser with this article's panel:
| Panel width | Columns | How the cells end up |
|---|---|---|
| 1336 px | 4 | Two rows: the indicators and the traffic; the errors per hour, the errors per day and the sales |
| 836 px | 2 | Four rows: the indicators; the traffic; the errors per hour; the errors per day and the sales |
| 436 px | 1 | Six rows, one cell in each, in the same order |
Cells are never reordered: the order of cells is the reading order at every size. A wide cell that does not fit in what is left of a row moves to the next one and leaves a gap at the end. To avoid it, make the cells of each row add up to the columns of the size, as here: 1 + 1 + 2 and 2 + 1 + 1.
Each chart in its cell
DashboardCell puts a chart in the cell whose id matches its cell. In React, the chart has to be the direct child of DashboardCell, because the panel passes it the size as props.
The chart takes the cell's width and height, unless it sets its own with width and height. With the panel at 1336 px, each single-column cell measures 314 × 240 px, and the two-column one, 644 × 240 px.
If the panel and its children do not match, the panel keeps working but warns in development with SP015: a child that names a cell the layout does not declare is placed at the end with one column, and a layout cell with no child is dropped.
The panel also hands out the style, as article 12 announced. ground, substrate, mode, locale and palette set on Dashboard pass to all its charts. Each field is resolved in the order from article 09, and the first one that declares it wins: the chart's own prop, the dashboard that holds it, the nearest provider and the library's default value. With substrate="green" on the panel and substrate="ochre" on the errors per hour, five charts are drawn in green and one in ochre.
The dashboard's own frame, with its background and its title, follows the same rule since silverpoint 0.10.0: where the dashboard declares no ground, substrate or palette, it takes the provider's, as its charts do. Up to 0.9.2 the frame did not read the provider and kept the default ground (silverpoint#17). The server dashboard, @silverpoint/react/server/dashboard, still does not read it: there is no provider there.
Linked charts
With link={{ key: 'hour' }}, exploring one chart marks in the others the items with the same hour value. That is what the image shows: the pointer is on hour 11 of the traffic, and hour 11 is marked in the error bars and in the curves of the two indicators, whose rows also have hour.
onLinkChange receives { key, value } when the linked value changes, and null when it is cleared. The errors per day and the sales by channel do not have the hour field: they show no mark and, in development, warn once with SP016. That is expected in a panel that mixes hourly data with data that is not. When focus is on one of those charts, onLinkChange receives hour with the value undefined, which is why the example checks link?.value == null.
Linked marks are visual only. The screen reader announces the item of the chart that has focus, not those of the others.
The keyboard
The panel adds no tab stops of its own. Tab goes through the charts in the order of cells, the same at all three sizes, and on entering each chart its first item becomes active. Inside, the arrows go through the items, as in any chart. In this panel the route is: the two indicators, the traffic, the errors per hour, the errors per day and the sales.
The panel in Vue
The same panel, with SpDashboard, SpDashboardCell and the @link-change event. Replace src/App.vue:
<script setup lang="ts">
import { ref } from 'vue';
import { SpBarChart } from '@silverpoint/vue/bar-chart';
import { SpDashboard, SpDashboardCell, type DashboardLayout } from '@silverpoint/vue/dashboard';
import { SpDonutChart } from '@silverpoint/vue/donut-chart';
import { SpHeatmapChart } from '@silverpoint/vue/heatmap-chart';
import { SpKpiCard } from '@silverpoint/vue/kpi-card';
import { SpLineChart } from '@silverpoint/vue/line-chart';
import { blocks, errorsByDay, hourly, sales } from './ops';

const layout: DashboardLayout = {
  columns: { sm: 1, md: 2, lg: 4 },
  rowHeight: 240,
  gap: 16,
  cells: [
    { id: 'hits-today' },
    { id: 'errors-today' },
    { id: 'traffic', colSpan: { md: 2, lg: 2 } },
    { id: 'errors-hour', colSpan: { md: 2, lg: 2 } },
    { id: 'errors-day' },
    { id: 'channels' },
  ],
};

const linked = ref('—');

function onLinkChange(link: { key: string; value: unknown } | null) {
  linked.value = link?.value == null ? '—' : `${link.key} ${String(link.value)}`;
}
</script>

<template>
  <main>
    <SpDashboard
      id="ops"
      title="Operations"
      description="Traffic, errors and sales of the web service today."
      :layout="layout"
      :link="{ key: 'hour' }"
      @link-change="onLinkChange"
    >
      <SpDashboardCell cell="hits-today">
        <SpKpiCard title="Hits today" :data="hourly" value-key="hits" :value="886" unit="thousand hits" :delta="4.2" />
      </SpDashboardCell>
      <SpDashboardCell cell="errors-today">
        <SpKpiCard title="Errors today" :data="hourly" value-key="errors" :value="103" unit="errors" :delta="-12" />
      </SpDashboardCell>
      <SpDashboardCell cell="traffic">
        <SpLineChart title="Hits per hour" :data="hourly" x-key="hour" value-key="hits" footer-left="Thousands" />
      </SpDashboardCell>
      <SpDashboardCell cell="errors-hour">
        <SpBarChart title="Errors per hour" :data="hourly" x-key="hour" value-key="errors" />
      </SpDashboardCell>
      <SpDashboardCell cell="errors-day">
        <SpHeatmapChart
          title="Errors by day"
          :data="errorsByDay"
          label-key="day"
          values-key="values"
          :column-labels="blocks"
          :scale-max="40"
        />
      </SpDashboardCell>
      <SpDashboardCell cell="channels">
        <SpDonutChart title="Sales by channel" :data="sales" name-key="channel" value-key="sales" center-label="thousand EUR" />
      </SpDashboardCell>
    </SpDashboard>
    <p>Linked: {{ linked }}</p>
  </main>
</template>
The panel in Angular
In Angular the event is the (linkChange) output. Replace src/app/app.ts:
import { Component, signal } from '@angular/core';
import { SpBarChart } from '@silverpoint/angular/bar-chart';
import { SpDashboard, SpDashboardCell, type DashboardLayout } from '@silverpoint/angular/dashboard';
import { SpDonutChart } from '@silverpoint/angular/donut-chart';
import { SpHeatmapChart } from '@silverpoint/angular/heatmap-chart';
import { SpKpiCard } from '@silverpoint/angular/kpi-card';
import { SpLineChart } from '@silverpoint/angular/line-chart';
import { blocks, errorsByDay, hourly, sales } from './ops';

@Component({
  selector: 'app-root',
  imports: [SpDashboard, SpDashboardCell, SpKpiCard, SpLineChart, SpBarChart, SpHeatmapChart, SpDonutChart],
  template: `
    <main>
      <sp-dashboard
        id="ops"
        title="Operations"
        description="Traffic, errors and sales of the web service today."
        [layout]="layout"
        [link]="{ key: 'hour' }"
        (linkChange)="onLinkChange($event)"
      >
        <sp-dashboard-cell cell="hits-today">
          <sp-kpi-card title="Hits today" [data]="hourly" valueKey="hits" [value]="886" unit="thousand hits" [delta]="4.2" />
        </sp-dashboard-cell>
        <sp-dashboard-cell cell="errors-today">
          <sp-kpi-card title="Errors today" [data]="hourly" valueKey="errors" [value]="103" unit="errors" [delta]="-12" />
        </sp-dashboard-cell>
        <sp-dashboard-cell cell="traffic">
          <sp-line-chart title="Hits per hour" [data]="hourly" xKey="hour" valueKey="hits" footerLeft="Thousands" />
        </sp-dashboard-cell>
        <sp-dashboard-cell cell="errors-hour">
          <sp-bar-chart title="Errors per hour" [data]="hourly" xKey="hour" valueKey="errors" />
        </sp-dashboard-cell>
        <sp-dashboard-cell cell="errors-day">
          <sp-heatmap-chart
            title="Errors by day"
            [data]="errorsByDay"
            labelKey="day"
            valuesKey="values"
            [columnLabels]="blocks"
            [scaleMax]="40"
          />
        </sp-dashboard-cell>
        <sp-dashboard-cell cell="channels">
          <sp-donut-chart title="Sales by channel" [data]="sales" nameKey="channel" valueKey="sales" centerLabel="thousand EUR" />
        </sp-dashboard-cell>
      </sp-dashboard>
      <p>Linked: {{ linked() }}</p>
    </main>
  `,
})
export class App {
  protected readonly hourly = hourly;
  protected readonly errorsByDay = errorsByDay;
  protected readonly blocks = blocks;
  protected readonly sales = sales;
  protected readonly linked = signal('—');

  protected readonly layout: DashboardLayout = {
    columns: { sm: 1, md: 2, lg: 4 },
    rowHeight: 240,
    gap: 16,
    cells: [
      { id: 'hits-today' },
      { id: 'errors-today' },
      { id: 'traffic', colSpan: { md: 2, lg: 2 } },
      { id: 'errors-hour', colSpan: { md: 2, lg: 2 } },
      { id: 'errors-day' },
      { id: 'channels' },
    ],
  };

  protected onLinkChange(link: { key: string; value: unknown } | null) {
    this.linked.set(link?.value == null ? '—' : `${link.key} ${String(link.value)}`);
  }
}
The panel in Reflex
In Reflex the data moves to Python. ops_panel/ops.py:
HOURLY = [
    {"hour": "00", "hits": 18, "errors": 2},
    {"hour": "01", "hits": 14, "errors": 1},
    {"hour": "02", "hits": 11, "errors": 1},
    {"hour": "03", "hits": 9, "errors": 0},
    {"hour": "04", "hits": 11, "errors": 1},
    {"hour": "05", "hits": 16, "errors": 1},
    {"hour": "06", "hits": 24, "errors": 2},
    {"hour": "07", "hits": 33, "errors": 4},
    {"hour": "08", "hits": 42, "errors": 6},
    {"hour": "09", "hits": 51, "errors": 7},
    {"hour": "10", "hits": 58, "errors": 9},
    {"hour": "11", "hits": 62, "errors": 8},
    {"hour": "12", "hits": 64, "errors": 11},
    {"hour": "13", "hits": 61, "errors": 9},
    {"hour": "14", "hits": 59, "errors": 7},
    {"hour": "15", "hits": 58, "errors": 6},
    {"hour": "16", "hits": 57, "errors": 6},
    {"hour": "17", "hits": 52, "errors": 5},
    {"hour": "18", "hits": 47, "errors": 4},
    {"hour": "19", "hits": 41, "errors": 4},
    {"hour": "20", "hits": 30, "errors": 3},
    {"hour": "21", "hits": 26, "errors": 2},
    {"hour": "22", "hits": 22, "errors": 2},
    {"hour": "23", "hits": 20, "errors": 2},
]

ERRORS_BY_DAY = [
    {"day": "Mon", "values": [3, 5, 31, 38, 22, 8]},
    {"day": "Tue", "values": [2, 6, 28, 35, 20, 7]},
    {"day": "Wed", "values": [4, 7, 34, 40, 25, 9]},
    {"day": "Thu", "values": [3, 5, 29, 36, 21, 8]},
    {"day": "Fri", "values": [2, 6, 26, 30, 18, 10]},
    {"day": "Sat", "values": [1, 2, 9, 12, 10, 6]},
    {"day": "Sun", "values": [1, 1, 7, 10, 8, 5]},
]

BLOCKS = ["00-04", "04-08", "08-12", "12-16", "16-20", "20-24"]

SALES = [
    {"channel": "Web", "sales": 46},
    {"channel": "App", "sales": 31},
    {"channel": "Partners", "sales": 15},
    {"channel": "Phone", "sales": 8},
]
And the page, ops_panel/ops_panel.py:
import reflex as rx
from reflex_silverpoint_react import (
    bar_chart,
    dashboard,
    dashboard_cell,
    dashboard_cell_layout,
    dashboard_layout,
    donut_chart,
    heatmap_chart,
    kpi_card,
    line_chart,
)

from .ops import BLOCKS, ERRORS_BY_DAY, HOURLY, SALES

LAYOUT = dashboard_layout(
    [
        "hits-today",
        "errors-today",
        dashboard_cell_layout("traffic", col_span={"md": 2, "lg": 2}),
        dashboard_cell_layout("errors-hour", col_span={"md": 2, "lg": 2}),
        "errors-day",
        "channels",
    ],
    columns={"sm": 1, "md": 2, "lg": 4},
    row_height=240,
    gap=16,
)


class PanelState(rx.State):
    linked: str = "—"

    @rx.event
    def on_link(self, link: dict | None):
        value = link.get("value") if link else None
        self.linked = "—" if value is None else f"{link['key']} {value}"


def index() -> rx.Component:
    return rx.el.main(
        dashboard(
            dashboard_cell(
                kpi_card(
                    title="Hits today",
                    data=HOURLY,
                    value_key="hits",
                    value=886,
                    unit="thousand hits",
                    delta=4.2,
                ),
                cell="hits-today",
            ),
            dashboard_cell(
                kpi_card(
                    title="Errors today",
                    data=HOURLY,
                    value_key="errors",
                    value=103,
                    unit="errors",
                    delta=-12,
                ),
                cell="errors-today",
            ),
            dashboard_cell(
                line_chart(
                    title="Hits per hour",
                    data=HOURLY,
                    x_key="hour",
                    value_key="hits",
                    footer_left="Thousands",
                ),
                cell="traffic",
            ),
            dashboard_cell(
                bar_chart(
                    title="Errors per hour",
                    data=HOURLY,
                    x_key="hour",
                    value_key="errors",
                ),
                cell="errors-hour",
            ),
            dashboard_cell(
                heatmap_chart(
                    title="Errors by day",
                    data=ERRORS_BY_DAY,
                    label_key="day",
                    values_key="values",
                    column_labels=BLOCKS,
                    scale_max=40,
                ),
                cell="errors-day",
            ),
            dashboard_cell(
                donut_chart(
                    title="Sales by channel",
                    data=SALES,
                    name_key="channel",
                    value_key="sales",
                    center_label="thousand EUR",
                ),
                cell="channels",
            ),
            id="ops",
            title="Operations",
            description="Traffic, errors and sales of the web service today.",
            layout=LAYOUT,
            link="hour",
            on_link_change=PanelState.on_link,
        ),
        rx.el.p("Linked: ", PanelState.linked),
        padding="32px",
    )


app = rx.App()
app.add_page(index)
Three differences from the JavaScript adapters:
dashboard_layoutwrites the layout with Python names and hands it over with the names the component reads (colSpan,rowHeight). A string in the list is a single-column cell.link="hour"is the short form oflink={"key": "hour"}.on_link_changeis a backend event. It receives adictorNone, and the state updates the "Linked" text.
The four panels were checked in the browser with the panel at 1336, 836 and 436 px wide: the same columns, the same cells and the same keyboard route.
Common problems
SP014in the console. A cell takes more columns than a size has, almost always because of a numericcolSpanthat also applies atsm. Write it per size:{ md: 2, lg: 2 }.SP015in the console. Acelldoes not match anyidincells, or a layout cell has no chart. Check the names in both places.SP016in the console. A chart in the panel does not have thelinkfield. If it is a chart that should not be linked, as here, you can ignore it.- A chart does not fill its cell in React. There is another element between
DashboardCelland the chart. The chart has to be its direct child. - A gap at the end of a row. A wide cell did not fit in what was left of the row. Adjust the
colSpanvalues so each row adds up to its columns.
What comes next
The panel now has its shape. Article 14 goes back to the catalogue with the charts for distributions, comparisons and uncertainty, and 15 closes level 2 with hierarchies, flows and networks.
The dashboard guide in the documentation has the full reference for its props.