This is the Reflex article of level 1 of the series on silverpoint. It builds the same chart that article 03 builds in React, 04 in Vue and 05 in Angular, but here everything is written in Python. You can read this one alone: everything is installed from scratch.
What you will build
The first piece of the series' operations panel: a line chart with the hits per hour to a web service over the last 24 hours, in thousands.
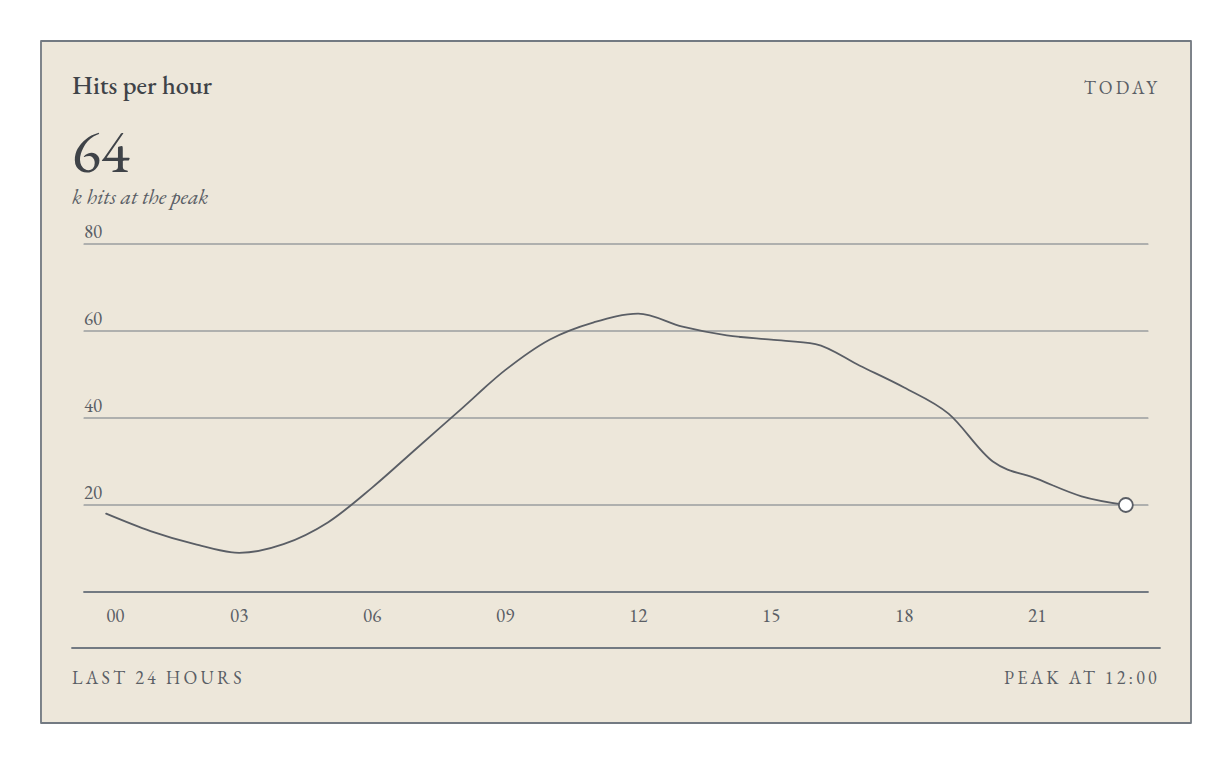
By the end you will have the chart with your own data, the card text and the data loaded into the Reflex state from a JSON file, as you would with an API or a database.
What you need
- Python 3.11 or later. This article uses 3.13.
- uv, for the project and its dependencies.
- Knowing the basics of Reflex: components, state and events.
There is no need to write JavaScript. Reflex downloads Bun, the JavaScript runtime it builds the page with, the first time it needs it.
1. Create the project
mkdir ops_panel && cd ops_panel
uv init --python 3.13
uv add reflex-silverpoint-react
uv run reflex init --template blank
rm main.py
uv add reflex-silverpoint-react installs the package and, as a dependency, Reflex. reflex init creates rxconfig.py and the application module, ops_panel/ops_panel.py. The main.py that uv init generates is not used.
There is nothing to install on the JavaScript side. When it compiles, Reflex installs @silverpoint/react and the other npm packages at the versions the package pins, and each component imports the stylesheets it needs.
2. The first chart
Replace ops_panel/ops_panel.py:
import reflex as rx
from reflex_silverpoint_react import line_chart


def index() -> rx.Component:
    return rx.box(
        line_chart(title="Hits per hour"),
        max_width="640px",
        padding="32px",
    )


app = rx.App()
app.add_page(index)
Start the application:
uv run reflex runAnd open http://localhost:3000. You will see a line chart with twelve hours and two series: the solid line and a dotted baseline.
It is the chart's demo data: when it does not receive data, it draws its own. It is there to check that the installation works.
Every component comes from the same module, reflex_silverpoint_react, with snake_case names: the charts with no prefix (line_chart, bar_chart) and the UI components with sp_ (sp_button).
3. Your own data
Create ops_panel/traffic.py with one day of hits, one row per hour:
TRAFFIC = [
    {"hour": "00", "hits": 18},
    {"hour": "01", "hits": 14},
    {"hour": "02", "hits": 11},
    {"hour": "03", "hits": 9},
    {"hour": "04", "hits": 11},
    {"hour": "05", "hits": 16},
    {"hour": "06", "hits": 24},
    {"hour": "07", "hits": 33},
    {"hour": "08", "hits": 42},
    {"hour": "09", "hits": 51},
    {"hour": "10", "hits": 58},
    {"hour": "11", "hits": 62},
    {"hour": "12", "hits": 64},
    {"hour": "13", "hits": 61},
    {"hour": "14", "hits": 59},
    {"hour": "15", "hits": 58},
    {"hour": "16", "hits": 57},
    {"hour": "17", "hits": 52},
    {"hour": "18", "hits": 47},
    {"hour": "19", "hits": 41},
    {"hour": "20", "hits": 30},
    {"hour": "21", "hits": 26},
    {"hour": "22", "hits": 22},
    {"hour": "23", "hits": 20},
]

PEAK = max(TRAFFIC, key=lambda row: row["hits"])
Pass the data to the chart and complete the card. Replace ops_panel/ops_panel.py:
import reflex as rx
from reflex_silverpoint_react import line_chart

from .traffic import PEAK, TRAFFIC


def index() -> rx.Component:
    return rx.box(
        line_chart(
            data=TRAFFIC,
            x_key="hour",
            value_key="hits",
            title="Hits per hour",
            badge="Today",
            value=PEAK["hits"],
            unit="k hits at the peak",
            footer_left="Last 24 hours",
            footer_right=f"Peak at {PEAK['hour']}:00",
            height=200,
        ),
        max_width="640px",
        padding="32px",
    )


app = rx.App()
app.add_page(index)
The props are the same as in React, written in snake_case:
| Prop | What it does |
|---|---|
data | The rows that are drawn |
x_key | The field of each row that goes on the horizontal axis |
value_key | The field with the value the line draws |
title | The card title |
badge | A short label, top right |
value and unit | The highlighted value and its unit, below the title |
footer_left and footer_right | The card footer |
height | The height of the drawing area in pixels; 160 by default |
The width is not set: the chart takes its container's, the 640-pixel rx.box.
Here the data are Python constants. Reflex writes them into the page when it compiles, so this version does not need the backend to show the chart.
The white heightened point is at the end of the line, not at the peak. It is the single heightening rule from article 01: in a line chart, the live value is heightened, the last one of the series. The peak is told by the highlighted value and the footer.
4. Load the data into the state
In a real panel the data comes from an API or a database, and it changes. In Reflex, that is the state's job: the backend reads the data and the page updates.
To simulate it, create data/traffic.json at the project root, next to rxconfig.py, with a timestamp and the number of requests per hour:
[
  {"time": "2026-11-11T00:00:00Z", "requests": 17800},
  {"time": "2026-11-11T01:00:00Z", "requests": 13937},
  {"time": "2026-11-11T02:00:00Z", "requests": 11074},
  {"time": "2026-11-11T03:00:00Z", "requests": 8811},
  {"time": "2026-11-11T04:00:00Z", "requests": 10948},
  {"time": "2026-11-11T05:00:00Z", "requests": 16085},
  {"time": "2026-11-11T06:00:00Z", "requests": 23822},
  {"time": "2026-11-11T07:00:00Z", "requests": 32959},
  {"time": "2026-11-11T08:00:00Z", "requests": 42096},
  {"time": "2026-11-11T09:00:00Z", "requests": 50833},
  {"time": "2026-11-11T10:00:00Z", "requests": 57970},
  {"time": "2026-11-11T11:00:00Z", "requests": 62107},
  {"time": "2026-11-11T12:00:00Z", "requests": 63844},
  {"time": "2026-11-11T13:00:00Z", "requests": 60981},
  {"time": "2026-11-11T14:00:00Z", "requests": 59118},
  {"time": "2026-11-11T15:00:00Z", "requests": 57855},
  {"time": "2026-11-11T16:00:00Z", "requests": 56992},
  {"time": "2026-11-11T17:00:00Z", "requests": 52129},
  {"time": "2026-11-11T18:00:00Z", "requests": 46866},
  {"time": "2026-11-11T19:00:00Z", "requests": 41003},
  {"time": "2026-11-11T20:00:00Z", "requests": 30140},
  {"time": "2026-11-11T21:00:00Z", "requests": 25877},
  {"time": "2026-11-11T22:00:00Z", "requests": 22014},
  {"time": "2026-11-11T23:00:00Z", "requests": 20151}
]
And replace ops_panel/ops_panel.py with the version with state:
import json
from pathlib import Path

import reflex as rx
from reflex_silverpoint_react import line_chart

DATA_FILE = Path("data/traffic.json")


class TrafficState(rx.State):
    traffic: list[dict[str, str | int]] = []

    @rx.event
    def load(self):
        rows = json.loads(DATA_FILE.read_text())
        self.traffic = [
            {"hour": row["time"][11:13], "hits": round(row["requests"] / 1000)}
            for row in rows
        ]

    @rx.var
    def peak(self) -> dict[str, str | int]:
        return max(self.traffic, key=lambda row: row["hits"], default={"hour": "", "hits": 0})


def index() -> rx.Component:
    return rx.box(
        rx.cond(
            TrafficState.traffic,
            line_chart(
                data=TrafficState.traffic,
                x_key="hour",
                value_key="hits",
                title="Hits per hour",
                badge="Today",
                value=TrafficState.peak["hits"],
                unit="k hits at the peak",
                footer_left="Last 24 hours",
                footer_right=f"Peak at {TrafficState.peak['hour']}:00",
                height=200,
            ),
            rx.text("Loading…"),
        ),
        max_width="640px",
        padding="32px",
    )


app = rx.App()
app.add_page(index, on_load=TrafficState.load)
ops_panel/traffic.py is no longer used; you can delete it. Four decisions in this version:
- The data is adapted in the backend. The
loadevent turns each JSON row into a chart row: the hour comes from the timestamp and the requests become thousands. Only the rows the chart draws reach the browser. - The data is loaded when the page opens.
on_load=TrafficState.loadruns the event every time the route opens. To read from an API or a database, only the body ofloadchanges. - While there is no data, there is no chart.
rx.condshows "Loading…" whiletrafficis empty. Do not pass an empty list to the chart: with empty data it draws its empty state, "No data", not the demo data. - The peak is a computed var.
peakis recomputed every timetrafficchanges. In the page it is used like any state var, inside an f-string too:f"Peak at {TrafficState.peak['hour']}:00"is not fixed text, Reflex turns it into an expression the browser evaluates with the current value.
The DATA_FILE path is relative to the directory you start Reflex from, the project root.
5. Run in production mode
uv run reflex run --env prodReflex builds the optimized frontend and serves the page and the backend on the same port, http://localhost:3000. To deploy it, the Reflex deployment guide explains the options.
Common problems
- The chart does not appear. Its container has no width. It happens with an
rx.hstackor anrx.flexthat shrinks to its content: the chart waits until it can measure it and, in development, the browser console shows theSP003diagnostic. Give the container or the chart a width. - The card says "No data". The name in
x_keyorvalue_keydoes not match the fields of the rows. In development, the browser console showsSP002with the name of the field. - "FileNotFoundError: [Errno 2] No such file or directory: 'data/traffic.json'". You started Reflex from another directory. Run it from the project root, where
rxconfig.pyis. - The chart stays at "Loading…". The backend does not respond. Look at the terminal where
reflex runis running: an error inloadshows up there.
The SP0xx diagnostics only appear in development.
What comes next
You now have a silverpoint chart in Reflex with your own data, without a line of JavaScript. The next one is 07: the properties the 60 charts share, with their names in the four syntaxes.
The Reflex guide in the documentation has more examples.