This is the Vue article of level 1 of the series on silverpoint. It builds the same chart that article 03 builds in React, so you can read this one alone: everything is installed from scratch here.
What you will build
The first piece of the series' operations panel: a line chart with the hits per hour to a web service over the last 24 hours, in thousands.
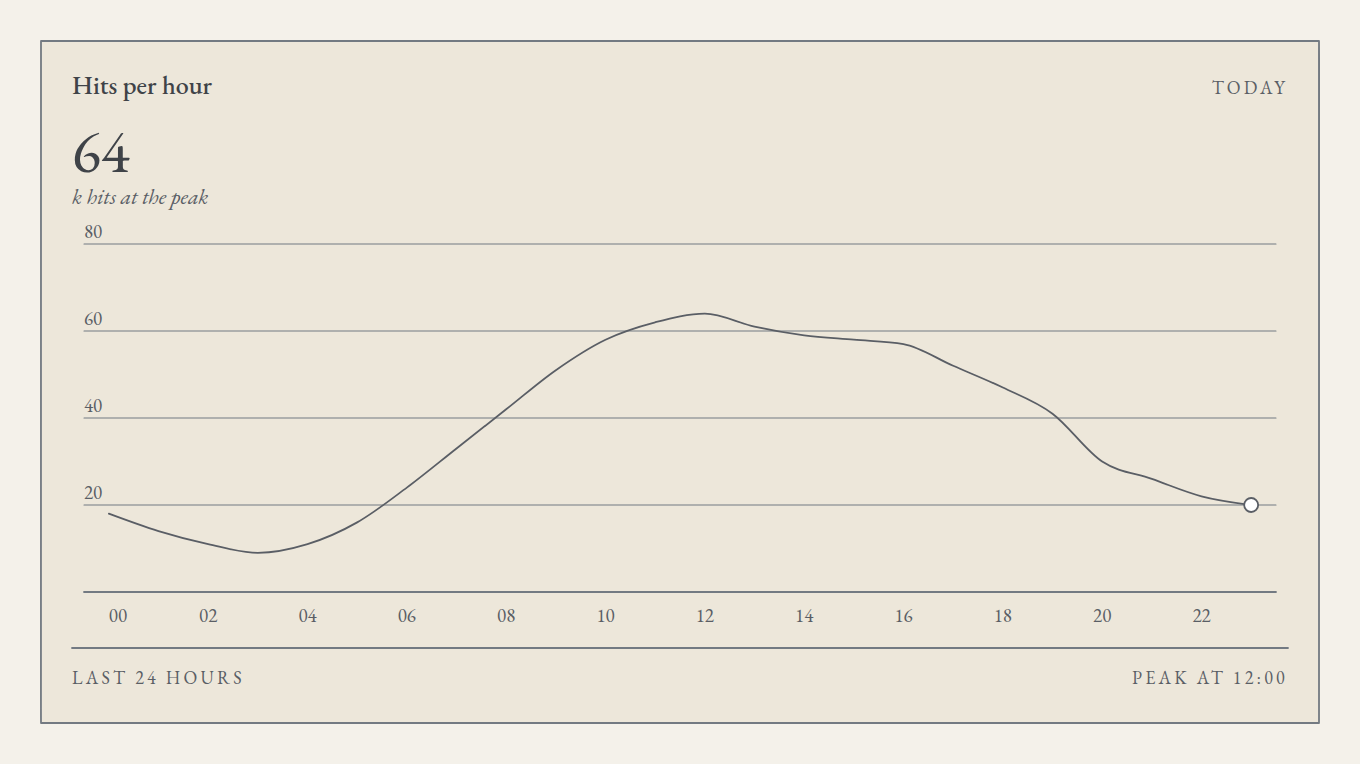
By the end you will have the chart with your own data, the card text and the data loaded from a JSON file, as you would with an API.
What you need
- Node.js 20.19 or later, or 22.12 or later. That is what Vite 8 asks for.
- npm, which comes with Node.
- Knowing the basics of Vue 3: components with
<script setup>,refandcomputed.
1. Create the project
npm create vite@latest ops-panel -- --template vue-ts --no-interactive
cd ops-panel
npm install
The --no-interactive option keeps Vite's wizard from asking questions. Without it, it may offer to install and start the project; if it does, answer no and go on with these steps.
2. Install silverpoint
The Vue adapter, the base styles and the typeface:
npm install @silverpoint/vue @silverpoint/grounds @silverpoint/fontsThe adapter requires Vue 3.5 or later, which is the version the template installs, and brings the engine, @silverpoint/core, as a dependency.
3. Prepare the entry point
The stylesheets are imported once. Replace the contents of src/main.ts:
import { createApp } from 'vue';
import '@silverpoint/fonts/fonts.css';
import '@silverpoint/grounds/styles.css';
import './style.css';
import App from './App.vue';

createApp(App).mount('#app');
Replace src/style.css, which holds the welcome page styles, with a few rules:
body {
  margin: 0;
  padding: 32px;
  background: #f4f1ea;
}
And delete the src/components and src/assets folders, which only that welcome page used.
4. The first chart
Replace src/App.vue:
<script setup lang="ts">
import { SpLineChart } from '@silverpoint/vue/line-chart';
</script>

<template>
  <main style="max-width: 640px">
    <SpLineChart title="Hits per hour" />
  </main>
</template>
Start the development server:
npm run devAnd open http://localhost:5173. You will see a line chart with twelve hours and two series: the solid line and a dotted baseline.
It is the chart's demo data: when it does not receive data, it draws its own. It is there to check that the installation works. If you see the cream background and the fine stroke, the stylesheets and the typeface are loaded correctly.
In Vue, every silverpoint component carries the Sp prefix, and each one has its own import path (@silverpoint/vue/line-chart), so your application only includes the ones you use.
5. Your own data
Create src/traffic.ts with one day of hits, one row per hour:
export type HourlyTraffic = {
  hour: string;
  hits: number;
};

export const traffic: HourlyTraffic[] = [
  { hour: '00', hits: 18 },
  { hour: '01', hits: 14 },
  { hour: '02', hits: 11 },
  { hour: '03', hits: 9 },
  { hour: '04', hits: 11 },
  { hour: '05', hits: 16 },
  { hour: '06', hits: 24 },
  { hour: '07', hits: 33 },
  { hour: '08', hits: 42 },
  { hour: '09', hits: 51 },
  { hour: '10', hits: 58 },
  { hour: '11', hits: 62 },
  { hour: '12', hits: 64 },
  { hour: '13', hits: 61 },
  { hour: '14', hits: 59 },
  { hour: '15', hits: 58 },
  { hour: '16', hits: 57 },
  { hour: '17', hits: 52 },
  { hour: '18', hits: 47 },
  { hour: '19', hits: 41 },
  { hour: '20', hits: 30 },
  { hour: '21', hits: 26 },
  { hour: '22', hits: 22 },
  { hour: '23', hits: 20 },
];
Pass the data to the chart and complete the card. Replace src/App.vue:
<script setup lang="ts">
import { SpLineChart } from '@silverpoint/vue/line-chart';
import { traffic } from './traffic';

const peak = traffic.reduce((max, row) => (row.hits > max.hits ? row : max));
</script>

<template>
  <main style="max-width: 640px">
    <SpLineChart
      :data="traffic"
      x-key="hour"
      value-key="hits"
      title="Hits per hour"
      badge="Today"
      :value="peak.hits"
      unit="k hits at the peak"
      footer-left="Last 24 hours"
      :footer-right="`Peak at ${peak.hour}:00`"
      :height="200"
    />
  </main>
</template>
In Vue templates, props are written in kebab-case (x-key, footer-left). The ones that receive a JavaScript value, and not a literal text, carry a colon in front (:data, :height).
| Prop | What it does |
|---|---|
data | The rows that are drawn |
x-key | The field of each row that goes on the horizontal axis |
value-key | The field with the value the line draws |
title | The card title |
badge | A short label, top right |
value and unit | The highlighted value and its unit, below the title |
footer-left and footer-right | The card footer |
height | The height of the drawing area in pixels; 160 by default |
The width is not set: the chart takes its container's, the 640-pixel <main>.
The white heightened point is at the end of the line, not at the peak. It is the single heightening rule from article 01: in a line chart, the live value is heightened, the last one of the series. The peak is told by the highlighted value and the footer.
6. Load the data from a JSON file
In a real panel the data comes from an API. To simulate it, create public/traffic.json with a timestamp and the number of requests per hour:
[
  {"time": "2026-11-11T00:00:00Z", "requests": 17800},
  {"time": "2026-11-11T01:00:00Z", "requests": 13937},
  {"time": "2026-11-11T02:00:00Z", "requests": 11074},
  {"time": "2026-11-11T03:00:00Z", "requests": 8811},
  {"time": "2026-11-11T04:00:00Z", "requests": 10948},
  {"time": "2026-11-11T05:00:00Z", "requests": 16085},
  {"time": "2026-11-11T06:00:00Z", "requests": 23822},
  {"time": "2026-11-11T07:00:00Z", "requests": 32959},
  {"time": "2026-11-11T08:00:00Z", "requests": 42096},
  {"time": "2026-11-11T09:00:00Z", "requests": 50833},
  {"time": "2026-11-11T10:00:00Z", "requests": 57970},
  {"time": "2026-11-11T11:00:00Z", "requests": 62107},
  {"time": "2026-11-11T12:00:00Z", "requests": 63844},
  {"time": "2026-11-11T13:00:00Z", "requests": 60981},
  {"time": "2026-11-11T14:00:00Z", "requests": 59118},
  {"time": "2026-11-11T15:00:00Z", "requests": 57855},
  {"time": "2026-11-11T16:00:00Z", "requests": 56992},
  {"time": "2026-11-11T17:00:00Z", "requests": 52129},
  {"time": "2026-11-11T18:00:00Z", "requests": 46866},
  {"time": "2026-11-11T19:00:00Z", "requests": 41003},
  {"time": "2026-11-11T20:00:00Z", "requests": 30140},
  {"time": "2026-11-11T21:00:00Z", "requests": 25877},
  {"time": "2026-11-11T22:00:00Z", "requests": 22014},
  {"time": "2026-11-11T23:00:00Z", "requests": 20151}
]
Vite serves public/ as is, at /traffic.json. Replace src/App.vue with the version that loads it:
<script setup lang="ts">
import { computed, onMounted, ref } from 'vue';
import { SpLineChart } from '@silverpoint/vue/line-chart';
import type { HourlyTraffic } from './traffic';

type ApiRow = { time: string; requests: number };

const toHourly = (rows: ApiRow[]): HourlyTraffic[] =>
  rows.map((row) => ({
    hour: row.time.slice(11, 13),
    hits: Math.round(row.requests / 1000),
  }));

const traffic = ref<HourlyTraffic[] | null>(null);

const peak = computed(() =>
  traffic.value?.reduce((max, row) => (row.hits > max.hits ? row : max)),
);

onMounted(async () => {
  const response = await fetch('/traffic.json');
  traffic.value = toHourly(await response.json());
});
</script>

<template>
  <main style="max-width: 640px">
    <p v-if="!traffic || !peak">Loading…</p>
    <SpLineChart
      v-else
      :data="traffic"
      x-key="hour"
      value-key="hits"
      title="Hits per hour"
      badge="Today"
      :value="peak.hits"
      unit="k hits at the peak"
      footer-left="Last 24 hours"
      :footer-right="`Peak at ${peak.hour}:00`"
      :height="200"
    />
  </main>
</template>
Three decisions in this version:
- The data is adapted before it reaches the chart.
toHourlyturns each API row into a chart row: the hour comes from the timestamp and the requests become thousands. - While there is no data, there is no chart. The template shows "Loading…" until the response arrives. Do not pass it an empty array: a chart with empty data draws its empty state, "No data", not the demo data.
- The chart is reactive.
trafficis arefandpeakacomputed. When they change, Vue updates the props and silverpoint redraws. If tomorrow you load the data every minute, there is nothing else to do.
7. Build for production
npm run build
npm run preview
npm run build checks the types with vue-tsc and generates the production version in dist/. With this project, the JavaScript weighs about 166 kB, 59 kB gzipped, Vue included. The stylesheet weighs 7.5 kB. npm run preview serves that version at http://localhost:4173.
Common problems
- The line appears filled in black and there is loose text below the chart.
@silverpoint/grounds/styles.cssis missing fromsrc/main.ts. Without that stylesheet, the strokes have no colour and the data table that should be hidden shows. - The chart does not appear. Its container has no width. The chart waits until it can measure it and, in development, the console shows the
SP003diagnostic. - The card says "No data". The name in
x-keyorvalue-keydoes not match the fields of the rows. In development, the console showsSP002with the name of the field. - The build fails with "Type 'string' is not assignable to type 'number'". A prop that receives a number, an array or an object is missing the colon.
height="200"passes the text"200"; the right form is:height="200".
The SP0xx diagnostics only appear in development.
What comes next
You now have a silverpoint chart in Vue with your own data. If you use Vue, the next one on your route is 07: the properties the 60 charts share. Articles 05 and 06 build this same chart in Angular and in Reflex.
The Vue guide in the documentation has more examples.