So far, the charts in the series on silverpoint received their data once. A real operations panel updates itself: a new reading arrives and the chart moves. This level 3 article does that with the hits-per-hour chart and then measures what it costs.
What you will build
The hits-per-hour chart from articles 03 to 06, turned into a window over the last 24 hours that moves on its own: every two seconds the next hour arrives and the oldest one leaves.
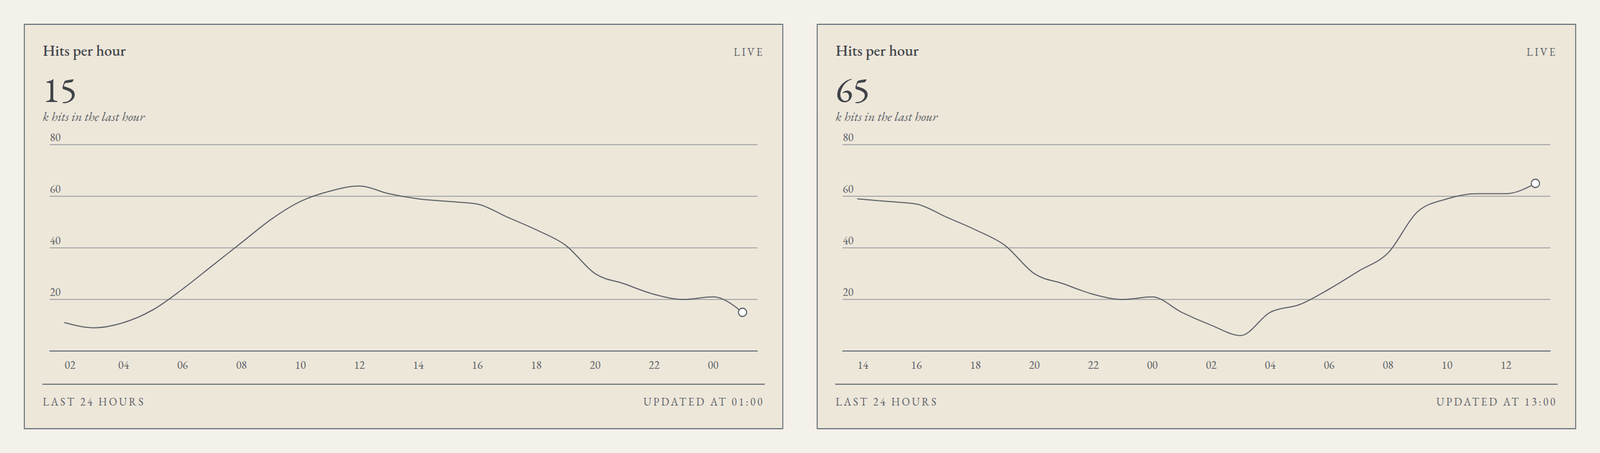
The second half of the article measures the chart: how long an update takes, how much its paths weigh, how much data it accepts and how much it adds to the bundle.
What you need
Your framework's project from articles 03 to 06, with the hits per hour from its own-data step: src/traffic.ts in React and Vue, src/app/traffic.ts in Angular and ops_panel/traffic.py in Reflex.
1. A window that moves
A function simulates the new readings. In a real panel they would come from an API, with fetch every so often or with an EventSource; the rest of the code does not change.
Create src/live.ts in React and Vue, or src/app/live.ts in Angular:
import { traffic, type HourlyTraffic } from './traffic';

// The next reading: the hour after the last one, taken from the day's
// profile with a small variation that changes from tick to tick.
export function nextReading(last: HourlyTraffic, tick: number): HourlyTraffic {
  const hour = (Number(last.hour) + 1) % 24;
  return {
    hour: String(hour).padStart(2, '0'),
    hits: traffic[hour].hits + ((tick * 7) % 9) - 4,
  };
}

// A rolling window: drop the oldest hour and append the new one.
export function advance(rows: readonly HourlyTraffic[], tick: number): HourlyTraffic[] {
  return [...rows.slice(1), nextReading(rows[rows.length - 1], tick)];
}
advance does not modify the rows it receives: it returns a new array. That is what lets React, Vue and Angular notice the change, as each framework will show.
2. In React
Replace src/App.tsx:
import { useEffect, useState } from 'react';
import { LineChart } from '@silverpoint/react/line-chart';
import { advance } from './live';
import { traffic } from './traffic';

export default function App() {
  const [rows, setRows] = useState(traffic);

  useEffect(() => {
    let tick = 0;
    const timer = setInterval(() => {
      tick += 1;
      setRows((current) => advance(current, tick));
    }, 2000);
    return () => clearInterval(timer);
  }, []);

  const last = rows[rows.length - 1];

  return (
    <main style={{ maxWidth: 640 }}>
      <LineChart
        id="live-hits"
        data={rows}
        xKey="hour"
        valueKey="hits"
        title="Hits per hour"
        badge="Live"
        value={last.hits}
        unit="k hits in the last hour"
        footerLeft="Last 24 hours"
        footerRight={`Updated at ${last.hour}:00`}
        height={200}
      />
    </main>
  );
}- The interval is cleaned up. The function
useEffectreturns stops the interval when the component unmounts. In development,StrictModemounts the component twice, and without that cleanup there would be two intervals. setRowsreceives a function. The interval is created only once, so it cannot readrowsdirectly: it would always see the rows of the first render. WithsetRows((current) => …), React passes it the current rows.- The chart has a fixed
id. The section "What is redrawn" explains why it matters.
3. In Vue
Replace src/App.vue:
<script setup lang="ts">
import { computed, onMounted, onUnmounted, shallowRef } from 'vue';
import { SpLineChart } from '@silverpoint/vue/line-chart';
import { advance } from './live';
import { traffic } from './traffic';

const rows = shallowRef(traffic);
const last = computed(() => rows.value[rows.value.length - 1]);

let timer: ReturnType<typeof setInterval> | undefined;

onMounted(() => {
  let tick = 0;
  timer = setInterval(() => {
    tick += 1;
    rows.value = advance(rows.value, tick);
  }, 2000);
});

onUnmounted(() => clearInterval(timer));
</script>

<template>
  <main style="max-width: 640px">
    <SpLineChart
      id="live-hits"
      :data="rows"
      x-key="hour"
      value-key="hits"
      title="Hits per hour"
      badge="Live"
      :value="last.hits"
      unit="k hits in the last hour"
      footer-left="Last 24 hours"
      :footer-right="`Updated at ${last.hour}:00`"
      :height="200"
    />
  </main>
</template>
shallowRef instead of ref: the array is replaced whole on each reading and never modified inside, so Vue only needs to watch the reference. With ref, Vue would also turn every row into a reactive object, work that is of no use here.
4. In Angular
Replace src/app/app.ts:
import { Component, computed, signal } from '@angular/core';
import { takeUntilDestroyed } from '@angular/core/rxjs-interop';
import { SpLineChart } from '@silverpoint/angular/line-chart';
import { interval } from 'rxjs';
import { advance } from './live';
import { traffic } from './traffic';

@Component({
  selector: 'app-root',
  imports: [SpLineChart],
  template: `
    <main style="max-width: 640px">
      <sp-line-chart
        id="live-hits"
        [data]="rows()"
        xKey="hour"
        valueKey="hits"
        title="Hits per hour"
        badge="Live"
        [value]="last().hits"
        unit="k hits in the last hour"
        footerLeft="Last 24 hours"
        [footerRight]="'Updated at ' + last().hour + ':00'"
        [height]="200"
      />
    </main>
  `,
})
export class App {
  protected readonly rows = signal(traffic);
  protected readonly last = computed(() => {
    const rows = this.rows();
    return rows[rows.length - 1];
  });

  constructor() {
    interval(2000)
      .pipe(takeUntilDestroyed())
      .subscribe((tick) => this.rows.update((current) => advance(current, tick + 1)));
  }
}
RxJS's interval emits 0, 1, 2… every two seconds, and takeUntilDestroyed cancels the subscription when the component is destroyed. rows.update replaces the signal with the new array, last is recomputed and the chart's inputs change. As in article 05, zone.js is not needed: silverpoint's components redraw following the signals.
5. In Reflex
In Reflex, the readings reach the state on the backend and Reflex sends the change to the browser. Create ops_panel/live.py, the same window in Python:
from .traffic import TRAFFIC


def next_reading(last: dict, tick: int) -> dict:
    """The hour after the last one, from the day's profile with a small variation."""
    hour = (int(last["hour"]) + 1) % 24
    return {"hour": f"{hour:02d}", "hits": TRAFFIC[hour]["hits"] + (tick * 7) % 9 - 4}


def advance(rows: list[dict], tick: int) -> list[dict]:
    """A rolling window: drop the oldest hour and append the new one."""
    return [*rows[1:], next_reading(rows[-1], tick)]
And replace ops_panel/ops_panel.py:
import asyncio

import reflex as rx
from reflex_silverpoint_react import line_chart

from .live import advance
from .traffic import TRAFFIC


class LiveState(rx.State):
    rows: list[dict[str, str | int]] = TRAFFIC

    @rx.var
    def last(self) -> dict[str, str | int]:
        return self.rows[-1]

    @rx.event(background=True)
    async def stream(self):
        tick = 0
        while True:
            await asyncio.sleep(2)
            tick += 1
            async with self:
                self.rows = advance(self.rows, tick)


def index() -> rx.Component:
    return rx.box(
        line_chart(
            id="live-hits",
            data=LiveState.rows,
            x_key="hour",
            value_key="hits",
            title="Hits per hour",
            badge="Live",
            value=LiveState.last["hits"],
            unit="k hits in the last hour",
            footer_left="Last 24 hours",
            footer_right=f"Updated at {LiveState.last['hour']}:00",
            height=200,
        ),
        max_width="640px",
        padding="32px",
    )


app = rx.App()
app.add_page(index, on_load=LiveState.stream)
stream is a background task: @rx.event(background=True) lets it run without blocking other events, and it can only modify the state inside async with self, which holds the state exclusively just long enough to write the new rows.
What happens to the while True loop when the user leaves? The task starts with on_load, and in Reflex 0.10.1 that ties it to the page load. I checked it with the server running: when the tab is closed, Reflex cancels the task, and on reload, the new load cancels the previous one, so two never run. A task you start some other way, with a button for example, is not cancelled on its own; the Reflex documentation explains how to stop it.
What is redrawn
With each new reading, the chart recomputes everything it draws: scales, axes, the curve and its inking. There is no transition animation between the old window and the new one: the chart goes from one to the other in a single step.
What does not change is the element. In all four frameworks I measured that the chart's <svg> is the same node before and after each update; only its paths change. That is why the entry animation, which reveals the chart from left to right in 280 ms, is seen only once, on mount, and not on each reading. With prefers-reduced-motion: reduce it is never seen, as article 10 explained.
The heightening follows the data: it always marks the last point, the live value.
The id and the hand-drawn stroke
The line's tremor is not random on each render: it comes from a seed, and the seed comes from the id. I measured it by comparing the paths:
| Render | Paths |
|---|---|
The same id and the same data | Identical |
Another id and the same data | Different |
That is why a live chart must have a fixed id. If you generate it on each render, for example from the current time, the line would tremble differently on each reading even if the data were the same. Article 19 comes back to this, because server rendering depends on the same thing.
A curious fact from the tests: at the same width, React, Vue and Angular drew exactly the same paths on each reading. The engine is the same, and so is the seed.
What it costs
To measure, I set up a test page with the production build of React and measured with performance.now() each complete update: React's render, silverpoint's geometry and inking and the write to the DOM. Each figure is the median of 15 to 30 updates, over three runs. These are numbers from my machine, a laptop with an AMD Ryzen AI 9 HX PRO 370 and headless Chrome 157; on yours they will differ, but the proportions hold.
| Chart | Update | Paths (d) |
|---|---|---|
| Line, 24 points | 1.4 to 1.9 ms | 1.9 KB |
| Line, 500 points | 6.5 to 6.7 ms | 20.9 KB |
| Line, 1440 points | 15 to 20 ms | 58.3 KB |
Bars, 24 bars, hatchFill="tile" | 1.8 to 2.3 ms | 8.1 KB |
Bars, 24 bars, hatchFill="per-shape" | 5.6 to 5.9 ms | 25.0 KB |
Area, 24 points, hatchFill="tile" | 1.5 to 2.3 ms | 5.6 KB |
Area, 24 points, hatchFill="per-shape" | 2.5 to 2.8 ms | 10.3 KB |
Three readings of the table:
- A normal chart fits easily in a frame. At 60 frames per second, each frame lasts about 16 ms. The panel's chart updates in under 2 ms.
- Per-shape filling is expensive. With
hatchFill="per-shape", each bar carries its own hatching: the path weight triples and the time more than doubles. The default,tile, shares one hatch pattern per tone level. - Volume shows. With 1440 points, an update no longer fits in a frame and the paths go over 40 KB.
The two warnings
Silverpoint watches those two limits and, in development, warns in the console:
| Warning | When | What I saw with 1440 points |
|---|---|---|
SP008 | A series goes over 500 points | "1440 points; the ceiling is 500 per series. Aggregate the data before charting it." |
SP011 | A chart's paths go over 40 KB | "58331 bytes of path data. Use hatchFill: 'tile' or a larger hatch gap." |
SP011 suggests hatchFill, because hatching is the most common cause. A line chart has no hatching: the cause is the number of points, and the fix is the one for SP008. The 40 KB matter outside the browser too: a chart rendered on the server travels with all its paths inside the HTML.
Aggregate before drawing
If your API gives one reading a minute, that is 1440 rows a day. A 640-pixel line cannot show 1440 distinct values: each point would get less than half a pixel. Aggregate them before passing them to the chart. In TypeScript:
import type { HourlyTraffic } from './traffic';

export type MinuteReading = { minute: string; requests: number };

// 1,440 readings a minute become 24 rows an hour, in thousands of requests.
export function perHour(readings: readonly MinuteReading[]): HourlyTraffic[] {
  const totals = new Map<string, number>();
  for (const { minute, requests } of readings) {
    const hour = minute.slice(0, 2);
    totals.set(hour, (totals.get(hour) ?? 0) + requests);
  }
  return [...totals].map(([hour, requests]) => ({ hour, hits: Math.round(requests / 1000) }));
}
And in Python, for Reflex:
from collections import defaultdict


def per_hour(readings: list[dict]) -> list[dict]:
    """1,440 readings a minute become 24 rows an hour, in thousands of requests."""
    totals: dict[str, int] = defaultdict(int)
    for reading in readings:
        totals[reading["minute"][:2]] += reading["requests"]
    return [
        {"hour": hour, "hits": round(total / 1000)} for hour, total in totals.items()
    ]
Both functions turn the 1440 per-minute readings into the panel's 24 per-hour rows. In Reflex, aggregating on the backend has one more advantage: only 24 rows travel to the browser on each update, not 1440.
Bundle size
Each chart is imported from its own path, like @silverpoint/react/line-chart. The package also has a general entry, @silverpoint/react, with every chart. I measured the production build of this article's React app with Vite:
| The app | JavaScript | Gzipped |
|---|---|---|
| No chart, just React and the interval | 220.3 kB | 68.9 kB |
With LineChart from @silverpoint/react/line-chart | 316.6 kB | 101.5 kB |
With LineChart from @silverpoint/react | 316.6 kB | 101.5 kB |
With LineChart and BarChart, each from its own path | 320.6 kB | 102.7 kB |
The first chart adds about 33 kB compressed: the engine, the ground, the inking and the chart. The second adds a little over 1 kB, because it shares everything else.
In production, the general entry and the chart's own path give exactly the same bundle: Vite drops the charts you do not use. The difference is in development. With the general entry, the development server loads the code of every chart: in my test, about 1.5 MB more on each page load. Importing each chart from its own path keeps development light and does not depend on your bundler dropping what is left over.
Measuring it in your app
To measure an update in your own code, mark the start and the end with the browser's Performance API. In React, flushSync makes the update happen entirely inside the measurement:
  useEffect(() => {
    let tick = 0;
    const timer = setInterval(() => {
      tick += 1;
      performance.mark('update-start');
      flushSync(() => setRows((current) => advance(current, tick)));
      performance.measure('chart update', 'update-start');
    }, 2000);
    return () => clearInterval(timer);
  }, []);
Import flushSync from react-dom. Each measurement shows up in the Timings section of the browser tools' Performance panel, and also in the console:
performance.getEntriesByName('chart update').map((entry) => entry.duration);On my machine, this app gave between 1.6 and 3.2 ms per update. Remove flushSync when you are done: it forces React to update synchronously, and it only serves to make the measurement complete. In Vue, Angular and Reflex, the browser's Performance panel gives the same information without touching the code.
Common problems
- The chart does not move. The array was modified inside, with
pushorshift, instead of being replaced. React,shallowRefand signals compare the reference: if it is the same, there is no change. Always return a new array, likeadvance. - The line trembles differently on each reading. The chart's
idchanges on each render. Give it a fixedid. - In development, the chart moves two hours on each reading. There are two intervals: the interval cleanup is missing in
useEffector inonUnmounted. - The console shows
SP008orSP011. There are too many points or too much hatching. Aggregate the data or go back tohatchFill="tile".
What's next
The panel now updates itself and you know what each chart costs. Article 21 changes the kind of data: timelines with TimelineJS, drawn in silverpoint's style, like the certifications one on this very site.