Article 01 said that in silverpoint the irregularity of hand drawing lives only in the ornament, and that every chart has a precision mode that turns it off. This article of the series on silverpoint puts that to the test and walks through what makes a chart accessible: its name, its description, the data table, the keyboard and what a screen reader user hears.
What you will build
Two charts of the operations panel, sales by channel and errors by day and time slot, drawn twice: with hand inking, on the left, and in precision mode, on the right.
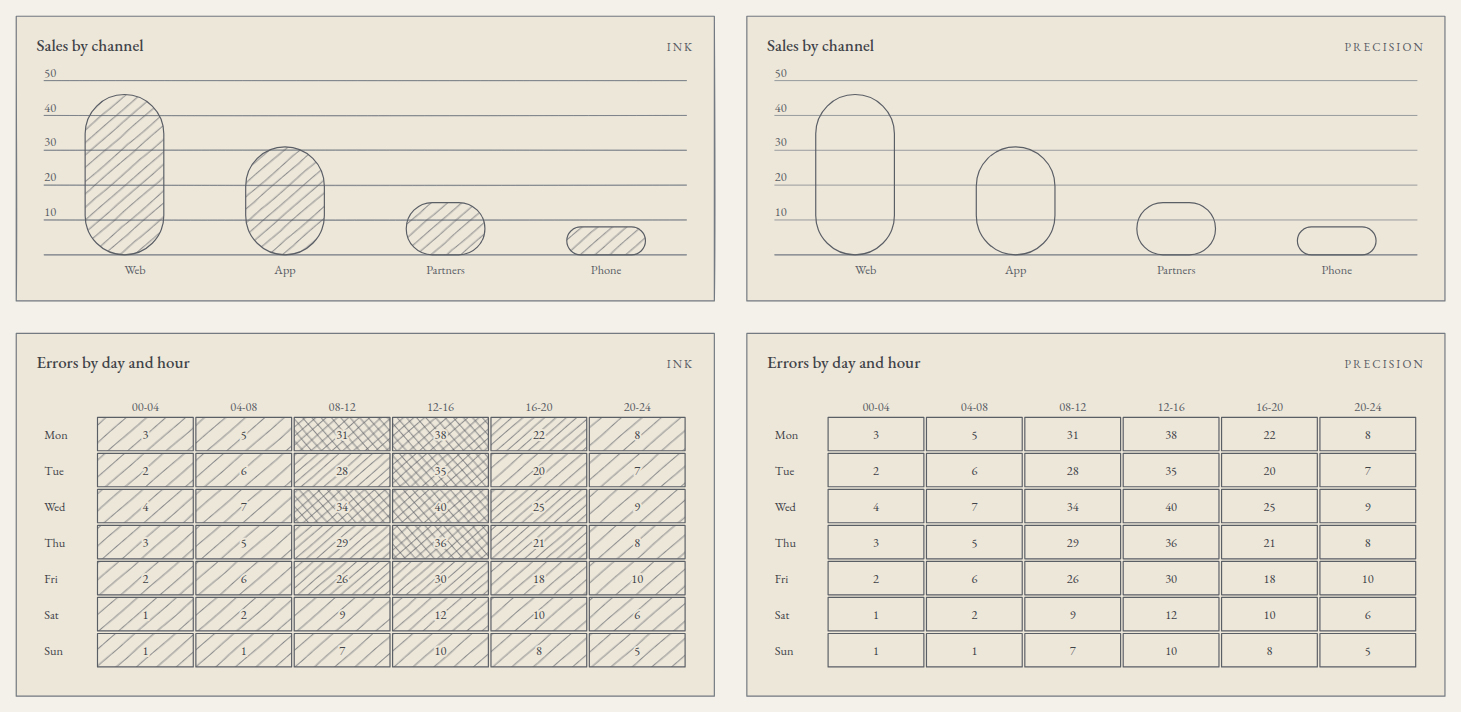
Then, the hits-per-hour chart with its name, its description and the data table in view, and the same work in Reflex.
What you need
The React project from article 03 or the Reflex one from article 06, with the hits per hour from its step 5 (src/traffic.ts) or its step 3 (ops_panel/traffic.py). In Vue and Angular the props of this article are written the same way: mode="precision" and data-table="visible" in Vue, mode="precision" and dataTable="visible" in Angular.
1. The data
Create src/sales.ts with the sales by channel, in thousands of euros:
export type ChannelSales = {
  channel: string;
  sales: number;
};

export const sales: ChannelSales[] = [
  { channel: 'Web', sales: 46 },
  { channel: 'App', sales: 31 },
  { channel: 'Partners', sales: 15 },
  { channel: 'Phone', sales: 8 },
];
And src/errors.ts with the errors of each weekday in six four-hour slots:
export type DayErrors = {
  day: string;
  values: number[];
};

export const blocks = ['00-04', '04-08', '08-12', '12-16', '16-20', '20-24'];

export const errors: DayErrors[] = [
  { day: 'Mon', values: [3, 5, 31, 38, 22, 8] },
  { day: 'Tue', values: [2, 6, 28, 35, 20, 7] },
  { day: 'Wed', values: [4, 7, 34, 40, 25, 9] },
  { day: 'Thu', values: [3, 5, 29, 36, 21, 8] },
  { day: 'Fri', values: [2, 6, 26, 30, 18, 10] },
  { day: 'Sat', values: [1, 2, 9, 12, 10, 6] },
  { day: 'Sun', values: [1, 1, 7, 10, 8, 5] },
];
2. Inking and precision, side by side
Replace src/App.tsx:
import { BarChart } from '@silverpoint/react/bar-chart';
import { HeatmapChart } from '@silverpoint/react/heatmap-chart';
import { blocks, errors } from './errors';
import { sales } from './sales';

const modes = ['ink', 'precision'] as const;

export default function App() {
  return (
    <main style={{ display: 'grid', gridTemplateColumns: '1fr 1fr', gap: 24, maxWidth: 1100 }}>
      {modes.map((mode) => (
        <section key={mode} style={{ display: 'grid', gap: 24 }}>
          <BarChart
            id={`sales-${mode}`}
            data={sales}
            xKey="channel"
            valueKey="sales"
            title="Sales by channel"
            badge={mode}
            mode={mode}
          />
          <HeatmapChart
            id={`errors-${mode}`}
            data={errors}
            labelKey="day"
            valuesKey="values"
            columnLabels={blocks}
            scaleMax={40}
            title="Errors by day and hour"
            badge={mode}
            mode={mode}
            height={220}
          />
        </section>
      ))}
    </main>
  );
}
Each chart carries its own id. The seed of the hand stroke and the identifiers of its SVG come from it, so two charts with the same props share nothing.
Compare the two columns. precision mode removes two things:
- The tremor of the hand. In
inkmode, the card frame, the rules and the grid are drawn with an irregular stroke. Inprecisionthey are exact lines. - The hatching. The bars and the heatmap cells lose their hatching, and the tone goes with it.
And it leaves alone everything that represents a value. The strokes that encode the values, the outline of each bar and the line of a line chart, have exactly the same coordinates in both modes: in the SVG they are the path elements with data-role="encoding", and their d attribute is identical. The texts, the numbers, the heightening of the live value, the data table and the interaction stay too.
The mode is chosen on each chart with the mode prop, or for a whole section with the provider (article 09) or with a dashboard (article 13).
3. When the system asks for more contrast
Two system preferences impose precision mode: prefers-contrast: more, when the user asks for more contrast, and forced-colors: active, the Windows high contrast mode. With either of them, every chart is drawn without inking and without hatching, even if it carries mode="ink". No prop undoes it.
The change applies live: if the user turns the preference on with the page open, the charts redraw without reloading. You can try it in Chrome, in the developer tools, Rendering panel, with "Emulate CSS media feature prefers-contrast".
The third preference is prefers-reduced-motion: reduce. Each chart enters with a short animation, 280 ms, that reveals it from left to right. With that preference, the animation does not run and the chart appears already drawn.
4. Name, description and table
Replace src/App.tsx with the hits chart and its accessible information:
import { LineChart } from '@silverpoint/react/line-chart';
import { traffic } from './traffic';

export default function App() {
  return (
    <main style={{ maxWidth: 640 }}>
      <LineChart
        id="hits"
        data={traffic}
        xKey="hour"
        valueKey="hits"
        title="Hits per hour"
        label="Hits per hour over the last 24 hours"
        description="Hits fall to 9 thousand at 03:00, peak at 64 thousand at 12:00 and close the day at 20 thousand."
        dataTable="visible"
        height={200}
      />
    </main>
  );
}
This is the structure a screen reader reads:
| Element | What it carries |
|---|---|
| The container | role="group", tabindex="0" and aria-label with the chart's name |
| The SVG | role="img", with a <title> and a <desc> |
| The table | One row per value, with the chart's name as its <caption> |
label is the accessible name. It goes into the aria-label, the SVG's <title> and the table's title. The visible title of the card is still title. Without label, the accessible name is the title itself.
description replaces the description the chart generates. Without it, the chart writes one from its data. For this chart it would be "Hits per hour. Line chart of 24 hour values; hits ranges from 9 to 64.". It is correct, but it does not say what matters: when the peak is. A description of your own tells it.
dataTable="visible" shows the table below the chart. By default it exists but is hidden from view, available to screen readers. The headers of its columns are the field names (hour, hits), so those names should be understandable.
5. The keyboard
Each chart is a tab stop. On arriving with Tab, the first element becomes active, its marker is drawn and the readout appears, just as when the pointer passes over it.
| Key | What it does |
|---|---|
| Right or down arrow | The next element |
| Left or up arrow | The previous element |
Home and End | The first and the last element |
Escape | Clears the active element |
Enter or space | Selects the active element |
In grid charts, such as the heatmap, the arrows move in two dimensions: left and right within the row, up and down between rows, and Home and End go to the start and the end of the row. Hierarchical charts, such as the treemap or the sunburst, follow the WAI-ARIA tree pattern: down and up walk the nodes depth first, right goes down to the first child and left goes up to the parent.
The focused container shows an outline in the ink colour. Selection with Enter or space reaches the same event as a click; article 11 uses it.
6. What is announced
Each chart has an aria-live="polite" region. When the active element changes, with the pointer or with the keyboard, the screen reader announces its value: in the hits chart, "hour 12, hits 64". In the heatmap it announces the row, the column and the value: "day Wed, 08-12 34". In a treemap it announces the path from the root, the value and the share of its parent: "node City budget › Public works, amount 19,197, 27.7% of City budget".
The visible readout is marked aria-hidden, so it is not read twice. The text of the announcement and that of the table come from the same calculation, so they always say the same thing.
7. Contrast and hatching
Each ground guarantees a minimum contrast against its substrate: 4.5:1 for text and 3:1 for graphical objects. It is a check in the project's continuous integration: a ground that does not meet it is not released. The six bundled palettes pass it too. A palette of your own may not; in development, the library warns with SP023, and article 12 explains how to check it beforehand.
The other guarantee is that no chart conveys anything through hatching alone. The screenshot shows it: in precision mode the heatmap has no tone any more, but each cell still writes its value. The donut chart names each sector with its percentage in the legend, and the bars are read against the axis. The tone repeats what a number, a label or a position already says, and that is why precision mode loses no information.
8. In Reflex
In Reflex the props are the same, in snake_case. Create ops_panel/ops_data.py:
SALES = [
    {"channel": "Web", "sales": 46},
    {"channel": "App", "sales": 31},
    {"channel": "Partners", "sales": 15},
    {"channel": "Phone", "sales": 8},
]

BLOCKS = ["00-04", "04-08", "08-12", "12-16", "16-20", "20-24"]

ERRORS = [
    {"day": "Mon", "values": [3, 5, 31, 38, 22, 8]},
    {"day": "Tue", "values": [2, 6, 28, 35, 20, 7]},
    {"day": "Wed", "values": [4, 7, 34, 40, 25, 9]},
    {"day": "Thu", "values": [3, 5, 29, 36, 21, 8]},
    {"day": "Fri", "values": [2, 6, 26, 30, 18, 10]},
    {"day": "Sat", "values": [1, 2, 9, 12, 10, 6]},
    {"day": "Sun", "values": [1, 1, 7, 10, 8, 5]},
]
And replace ops_panel/ops_panel.py:
import reflex as rx
from reflex_silverpoint_react import bar_chart, heatmap_chart, line_chart

from .ops_data import BLOCKS, ERRORS, SALES
from .traffic import TRAFFIC


def mode_column(mode: str) -> rx.Component:
    return rx.box(
        bar_chart(
            id=f"sales-{mode}",
            data=SALES,
            x_key="channel",
            value_key="sales",
            title="Sales by channel",
            badge=mode,
            mode=mode,
        ),
        heatmap_chart(
            id=f"errors-{mode}",
            data=ERRORS,
            label_key="day",
            values_key="values",
            column_labels=BLOCKS,
            scale_max=40,
            title="Errors by day and hour",
            badge=mode,
            mode=mode,
            height=220,
        ),
        display="grid",
        gap="24px",
    )


def index() -> rx.Component:
    return rx.box(
        rx.box(
            mode_column("ink"),
            mode_column("precision"),
            display="grid",
            grid_template_columns="1fr 1fr",
            gap="24px",
        ),
        rx.box(
            line_chart(
                id="hits",
                data=TRAFFIC,
                x_key="hour",
                value_key="hits",
                title="Hits per hour",
                label="Hits per hour over the last 24 hours",
                description=(
                    "Hits fall to 9 thousand at 03:00, peak at 64 thousand at 12:00 "
                    "and close the day at 20 thousand."
                ),
                data_table="visible",
                height=200,
            ),
            max_width="640px",
        ),
        display="grid",
        gap="32px",
        max_width="1100px",
        padding="32px",
    )


app = rx.App()
app.add_page(index)
mode_column is a plain Python function that returns a component; it is called twice, once per mode. The rest works as in React: the same accessible structure, the same keyboard, the same announcements and the same mode imposed by the system, because Reflex draws with the React component.
Check it yourself
- With the keyboard. Press
Tabuntil you reach the chart and walk it with the arrows. The marker and the readout should follow the focus. - With a screen reader. NVDA or JAWS on Windows, VoiceOver on macOS and Orca on Linux announce the name on entering and the value of each element as you move.
- With more contrast. Turn on "Increase contrast" in your system, or emulate
prefers-contrast: morein the developer tools. The charts should switch toprecisionwithout reloading. - Without styles. If you see the data table without having asked for
dataTable="visible",@silverpoint/grounds/styles.cssis missing: it is the stylesheet that hides it from view.
What comes next
Article 11 uses the active element and the selection from your own code: a readout next to the chart, a list of selected hours and a custom tooltip, in the four frameworks.