In article 0 we saw the map of the series. This article, the first of the fundamentals level, explains the idea behind silverpoint: why a 15th-century drawing technique is useful for reading data today, and which rules come out of it.
At the end there is an example with the same chart in React, Vue, Angular and Reflex. You do not need to install anything to follow the article: installation comes in article 02 and, in more detail, in articles 03 to 06.
The Silverpoint technique
Silverpoint is a drawing technique older than the graphite pencil. The artist draws with a silver stylus on a sheet of paper prepared beforehand with a thin coat of ground: burnt and powdered bone, glue and, very often, a pigment that tints the paper cream, green, blue or ochre. Without that coat, the silver leaves no mark.
The technique imposes its own rules:
- The line is fine and of a fixed weight. Pressing harder does not darken the stylus's line, so the stroke barely changes.
- Tone is built with hatching. To darken an area, the artist piles up parallel or crossed lines; more density, more tone.
- It cannot be erased. Every line stays, so the drawing demands deciding before drawing.
- Lights are added in white. On the tinted paper, the artist paints the brightest points in white. That heightening is used very sparingly.
Jan van Eyck, Leonardo da Vinci and Albrecht Dürer drew this way. The self-portrait Dürer made at thirteen, in 1484, is drawn in Silverpoint.
From the technique to the library's rules
The library takes those four rules and turns them into drawing rules for charts. They are written down in the project's constitution, and the code verifies them with tests.
| On paper | In silverpoint |
|---|---|
| Prepared mid-tone paper | The substrate: cream, green, blue or ochre, the substrate prop |
| Fine silver line | A stroke of fixed weight, the --sp-stroke-width CSS variable |
| Tone by hatching | Value is built from the density and angle of the lines, never from a flat fill with transparency |
| White heightening | A single heightened element per chart, the one that matters |
The last rule is the most visible. In a line chart, the heightened element is the last point, the live value of the series. Each chart declares which element it heightens, and the library does not allow heightening two.
The problem with hand-drawn charts
Other libraries also look hand-drawn. The best known is rough.js, which silverpoint uses internally. Its style, the so-called sketchy style, has a problem: if the stroke of a bar wobbles, its height is no longer exact. The study by Wood and colleagues on sketchy rendering in visualization (IEEE VIS 2012), which the constitution cites as its rationale, shows that irregular strokes degrade the reading of areas and proportions.
The library solves this by separating two kinds of stroke:
- The ornament: the card's frame, the rules, the grid lines and the hatching. This is where the irregularity of the hand lives.
- The geometry of the data: the position, length, angle and area that encode a value. This is always computed exactly.
That is why every chart has a precision mode that switches the inking off entirely, and the library guarantees that ink mode (the normal one) and precision mode draw the data with the same vertices.
Three variations of the same chart
This image shows the hits per hour of a web service, the data the series project starts with, drawn three times:
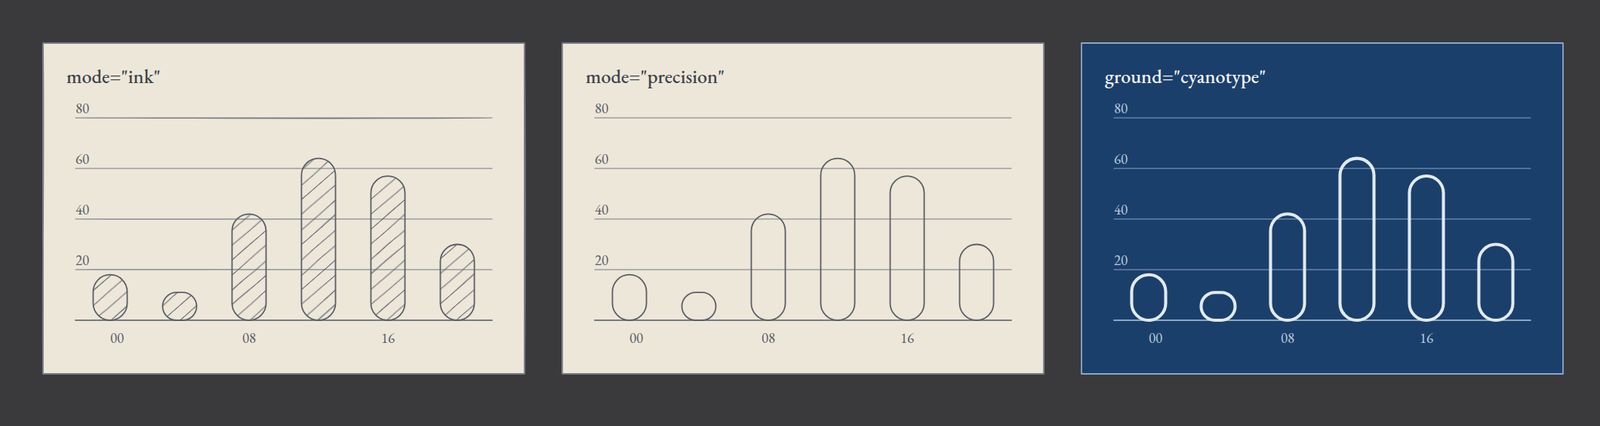
mode="ink": the default mode. The bars are hatched, and the frame and rules carry the pulse of the hand.mode="precision": no inking. The bars are the same, without hatching.ground="cyanotype": the second ground. Cyanotype, a photographic process from 1842, gives a white line on Prussian blue. Here tone is not built with hatching but with the weight of an exact line.
The code is the same in the four frameworks; only each one's syntax changes. In React:
import '@silverpoint/fonts/fonts.css';
import '@silverpoint/grounds/styles.css';
import { BarChart } from '@silverpoint/react/bar-chart';

const data = [
  { hour: '00', hits: 18 },
  { hour: '04', hits: 11 },
  { hour: '08', hits: 42 },
  { hour: '12', hits: 64 },
  { hour: '16', hits: 57 },
  { hour: '20', hits: 30 },
];

export default function App() {
  return (
    <div style={{ display: 'grid', gridTemplateColumns: 'repeat(3, 320px)', gap: 24 }}>
      <BarChart data={data} xKey="hour" valueKey="hits" title="ink" />
      <BarChart data={data} xKey="hour" valueKey="hits" title="precision" mode="precision" />
      <BarChart data={data} xKey="hour" valueKey="hits" title="cyanotype" ground="cyanotype" />
    </div>
  );
}
In Vue:
<script setup lang="ts">
import '@silverpoint/fonts/fonts.css';
import '@silverpoint/grounds/styles.css';
import { SpBarChart } from '@silverpoint/vue/bar-chart';

const data = [
  { hour: '00', hits: 18 },
  { hour: '04', hits: 11 },
  { hour: '08', hits: 42 },
  { hour: '12', hits: 64 },
  { hour: '16', hits: 57 },
  { hour: '20', hits: 30 },
];
</script>

<template>
  <div style="display: grid; grid-template-columns: repeat(3, 320px); gap: 24px">
    <SpBarChart :data="data" x-key="hour" value-key="hits" title="ink" />
    <SpBarChart :data="data" x-key="hour" value-key="hits" title="precision" mode="precision" />
    <SpBarChart :data="data" x-key="hour" value-key="hits" title="cyanotype" ground="cyanotype" />
  </div>
</template>
In Angular, with the two stylesheets imported in src/styles.css:
import { Component } from '@angular/core';
import { SpBarChart } from '@silverpoint/angular/bar-chart';

@Component({
  selector: 'app-root',
  imports: [SpBarChart],
  template: `
    <div style="display: grid; grid-template-columns: repeat(3, 320px); gap: 24px">
      <sp-bar-chart [data]="data" xKey="hour" valueKey="hits" title="ink" />
      <sp-bar-chart [data]="data" xKey="hour" valueKey="hits" title="precision" mode="precision" />
      <sp-bar-chart [data]="data" xKey="hour" valueKey="hits" title="cyanotype" ground="cyanotype" />
    </div>
  `,
})
export class App {
  protected readonly data = [
    { hour: '00', hits: 18 },
    { hour: '04', hits: 11 },
    { hour: '08', hits: 42 },
    { hour: '12', hits: 64 },
    { hour: '16', hits: 57 },
    { hour: '20', hits: 30 },
  ];
}
And in Reflex, with Python only:
import reflex as rx
from reflex_silverpoint_react import bar_chart

DATA = [
    {"hour": "00", "hits": 18},
    {"hour": "04", "hits": 11},
    {"hour": "08", "hits": 42},
    {"hour": "12", "hits": 64},
    {"hour": "16", "hits": 57},
    {"hour": "20", "hits": 30},
]


def index() -> rx.Component:
    return rx.grid(
        bar_chart(data=DATA, x_key="hour", value_key="hits", title="ink"),
        bar_chart(data=DATA, x_key="hour", value_key="hits", title="precision", mode="precision"),
        bar_chart(data=DATA, x_key="hour", value_key="hits", title="cyanotype", ground="cyanotype"),
        columns="3",
        spacing="5",
        width="1000px",
    )


app = rx.App()
app.add_page(index)
A detail worth knowing right away: the chart takes the width of its container. If the container has no width, for example an rx.hstack with no size, the chart waits for one and draws nothing. That is why the four examples give the grid a width.
Check it yourself
The promise that ink mode does not touch the data can be verified. This Node script draws the chart on the server with the server entry of the React adapter and compares the two modes:
import { createElement as h } from 'react';
import { renderToStaticMarkup } from 'react-dom/server';
import { BarChart } from '@silverpoint/react/server/bar-chart';

const data = [
  { hour: '00', hits: 18 },
  { hour: '04', hits: 11 },
  { hour: '08', hits: 42 },
  { hour: '12', hits: 64 },
  { hour: '16', hits: 57 },
  { hour: '20', hits: 30 },
];

const render = (mode) =>
  renderToStaticMarkup(
    h(BarChart, { data, xKey: 'hour', valueKey: 'hits', id: 'hits', width: 320, mode }),
  );

const bars = (svg) => [...svg.matchAll(/d="([^"]+)"[^>]*data-role="encoding"/g)].map((m) => m[1]);
const hatches = (svg) => (svg.match(/data-role="hatch"/g) ?? []).length;

const ink = render('ink');
const precision = render('precision');

console.log('same bars:', JSON.stringify(bars(ink)) === JSON.stringify(bars(precision)));
console.log('hatch strokes:', hatches(ink), 'in ink,', hatches(precision), 'in precision');
console.log('same strokes on every render:', ink === render('ink'));
Save it as verify.mjs in a project with @silverpoint/react installed and run it with node verify.mjs. The output is:
same bars: true
hatch strokes: 12 in ink, 0 in precision
same strokes on every render: true
The six bars have exactly the same path in both modes. The hatching, with its twelve lines, exists only in ink mode. And the third line anticipates the next idea.
On the server a chart cannot measure its container, so the script pins width. It also pins an id: outside a dashboard a server chart needs one, and if it is missing the library uses a fixed one and warns about it with the SP002 diagnostic.
The stroke does not change between renders
The hand of silverpoint is not random. Each chart has a seed, the seed prop. If you do not pass it, it is derived stably from the chart's id. The library does not call Math.random() or Date.now() while drawing. With the same props, the stroke is the same on every render, on the server and in any browser.
This has two practical consequences. A chart does not wobble when React, Vue or Angular redraw it. And a chart rendered on the server hydrates in the browser with no differences.
Accessible by default
The hand-drawn style is an aesthetic choice and cannot leave anyone out. That is why every chart:
- Exposes an accessible role and name. In the example, the SVG carries
role="img"and a description generated from the data: "Bar chart in columns of 6 hour values; hits from 11 to 64". - Includes a hidden data table for screen readers, controlled with the
dataTableprop (data_tablein Reflex). - Can be navigated with the keyboard.
- Switches automatically to
precisionmode when the system asks for more contrast (prefers-contrast: more) or forced colours (forced-colors: active).
Besides, no chart encodes information through the hatching style alone. Article 10 of the series goes into detail.
One engine, four frameworks
One piece is left: how do React, Vue, Angular and Reflex draw exactly the same thing?
All the geometry (scales, axes, arcs, paths) is computed in a single engine, @silverpoint/core, which depends on neither the DOM nor any framework. Each adapter only translates what the engine computes into its framework's nodes. Continuous integration compares the SVG each adapter produces with a reference version, character for character and with zero tolerance. Reflex uses the React adapter internally, so it inherits the same guarantee.
That is why the four examples above produce the same SVG: three charts, twelve hatching lines and the same bars.
And the style is data, not code. A ground such as silverpoint or cyanotype is a set of values (substrate, inks, inking parameters, typography, tonal mechanism), and adding a new one does not require changing any chart.
What comes next
You now know the ideas: the substrate, the line, the hatching, the single heightening, the exact geometry, determinism and accessibility. Article 02 walks through the map of packages: what the engine does, what the grounds and the fonts bring, which adapter to install and which packages are optional.
Meanwhile, you can see the grounds and substrates in the documentation and the 60 charts in the gallery.