This article opens a series of tutorials on silverpoint, a library of charts and UI components I have been building for React, Vue, Angular and, from Python, for Reflex.
This is article 0. It installs nothing and draws nothing: it explains what silverpoint is, how the series is organised, and which articles to read depending on the framework you use. If you only have five minutes, go straight to the "Reading paths" section.
What silverpoint is
Silverpoint draws charts in the visual language of a historical drawing technique: Renaissance silverpoint. A prepared middle-tone ground, a fine line, tone built from hatching, and white heightening kept for the value that matters.
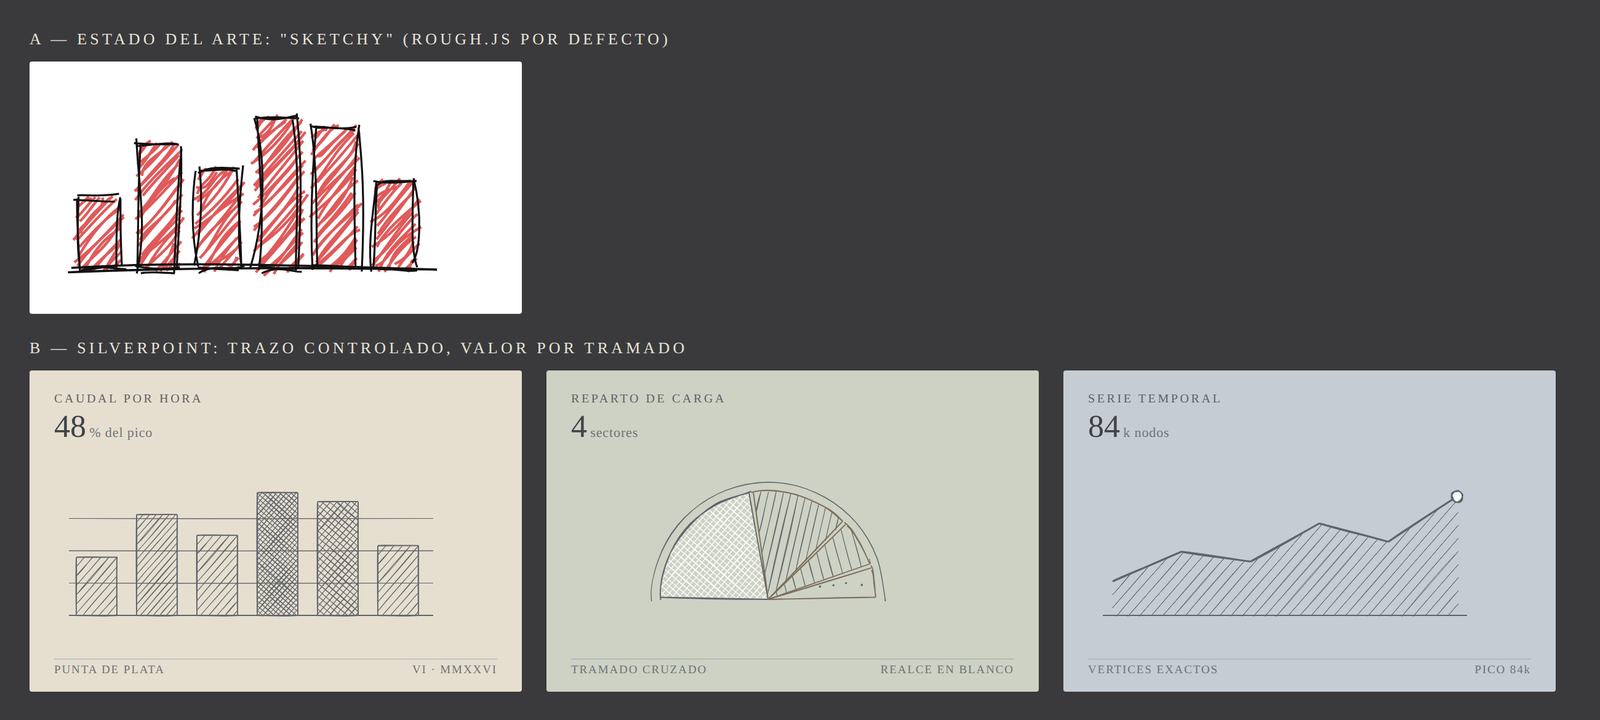
What sets it apart from other libraries with a hand-drawn look is where the irregularity lives: only in the ornament. The geometry that encodes the data is exact, and every chart has a precision mode that turns the inking off entirely.
In version 0.9.2, the library ships:
- 60 charts, each importable on its own.
- 38 UI components (forms, tables, navigation, modals) drawn in the same style.
- A
Dashboardcomponent for composing responsive dashboards. - Two base styles,
silverpointandcyanotype, and six colour palettes with verified contrast. - A timeline, slide decks written in Markdown, and an MCP server for working with AI assistants.
One package per framework
The engine is the same for everyone; what changes is the adapter you install.
| If you use | Install | Requirements |
|---|---|---|
| React | @silverpoint/react | React 18.2 or 19 |
| Vue | @silverpoint/vue | Vue 3.5 |
| Angular | @silverpoint/angular | Angular 21 or 22 |
| Reflex (Python) | reflex-silverpoint-react | Reflex 0.10, Python 3.11 |
As a preview of what installation looks like, here are React and Reflex:
npm install @silverpoint/react @silverpoint/grounds @silverpoint/fontspip install reflex-silverpoint-reactThe four adapters draw exactly the same thing from the same props. That is why most articles in the series explain a concept once and show the code in all four frameworks.
How the series is organised
There are 29 articles in five levels. Each level ends with something you can already use. Every article is published on this blog, in Spanish and in English, and comes with a video that follows the same steps.
| Level | Articles | When you finish, you can |
|---|---|---|
| 0. Foundations | 01 and 02 | Explain the ideas behind the library and know what to install |
| 1. First steps | 03 to 07 | Draw a chart from your own data |
| 2. Intermediate | 08 to 15 | Build a dashboard with its own style and interaction |
| 3. Advanced | 16 to 22 | Take the dashboard into an application with forms, tables and server rendering |
| 4. Projects and ecosystem | 23 to 29 | Ship a complete application and work with AI assistants |
The whole series builds a single project: an operations dashboard for a web service, with traffic per hour, errors and sales by channel. It starts as one chart and ends as a complete application.
The full list
Level 0. Foundations
- 01. What silverpoint is: charts drawn with a historical technique.
- 02. The package map: the engine, the styles and the adapters.
Level 1. First steps
- 03. Your first chart in React with Vite.
- 04. Your first chart in Vue 3.
- 05. Your first chart in Angular.
- 06. Your first chart in Reflex, in Python only.
- 07. The props all 60 charts share.
Level 2. Intermediate
- 08. How to choose a chart: the families of the catalog.
- 09. Base styles, substrates and the provider: one style for the whole application.
- 10. The
precisionmode and accessibility. - 11. Interaction: the active item, selection and a custom tooltip.
- 12. Palettes and re-theming.
- 13. Dashboards: a responsive grid defined as data.
- 14. Distributions, comparisons and uncertainty.
- 15. Hierarchies, flows and networks, with drill-down.
Level 3. Advanced
- 16. UI components (I): forms and display.
- 17. UI components (II): tables, composed components and overlays.
- 18. Exporting a chart to SVG.
- 19. Server rendering and determinism.
- 20. Live data and performance.
- 21. Timelines with TimelineJS.
- 22. Slide decks in Markdown with live charts.
Level 4. Projects and ecosystem
- 23. Final project in React with Next.js: the operations dashboard from start to finish.
- 24. Final project in Vue: the operations dashboard from start to finish.
- 25. Final project in Angular: the operations dashboard from start to finish.
- 26. Final project in Reflex: a complete application in Python with real data.
- 27. The same dashboard in four frameworks.
- 28. Silverpoint with AI: the MCP server and the skills for assistants.
- 29. How silverpoint was built.
Reading paths
You do not need to read all 29. Pick the path that fits your case; every path starts at article 01.
| Your case | Short path | To go further |
|---|---|---|
| You work in React | 01, 03, 07, 09, 11, 13 | 16, 17, 19, 23 |
| You work in Vue | 01, 04, 07, 09, 11, 13 | 16, 17, 19, 24 |
| You work in Angular | 01, 05, 07, 09, 11, 13 | 16, 17, 19, 25 |
| You work in Python with Reflex | 01, 06, 07, 09, 11, 13 | 15, 18, 26 |
| You are evaluating the library | 01, 02, 08, 10 | 27 |
| You care about using it with AI | 01, 28 | 08 |
Each framework's short path is six articles: at the end of it you have a dashboard with several charts, a shared style and interaction. The "To go further" column takes it to a complete application: each framework has its own final project.
A note for readers coming from Python: the Reflex path never touches JavaScript. Reflex installs the packages it needs by itself.
While the articles arrive
The documentation is already online and has a guide per framework:
You can also see all 60 charts live in the gallery.
The next article, 01, goes into the idea underneath: why a drawing technique from six hundred years ago helps us read data today.