Every silverpoint chart responds to the pointer and the keyboard: it marks the active element, shows a readout and announces its value. Article 10 walked through that part from the side of accessibility. This article of the series brings it into your code, with two events and one prop that the 60 charts share.
What you will build
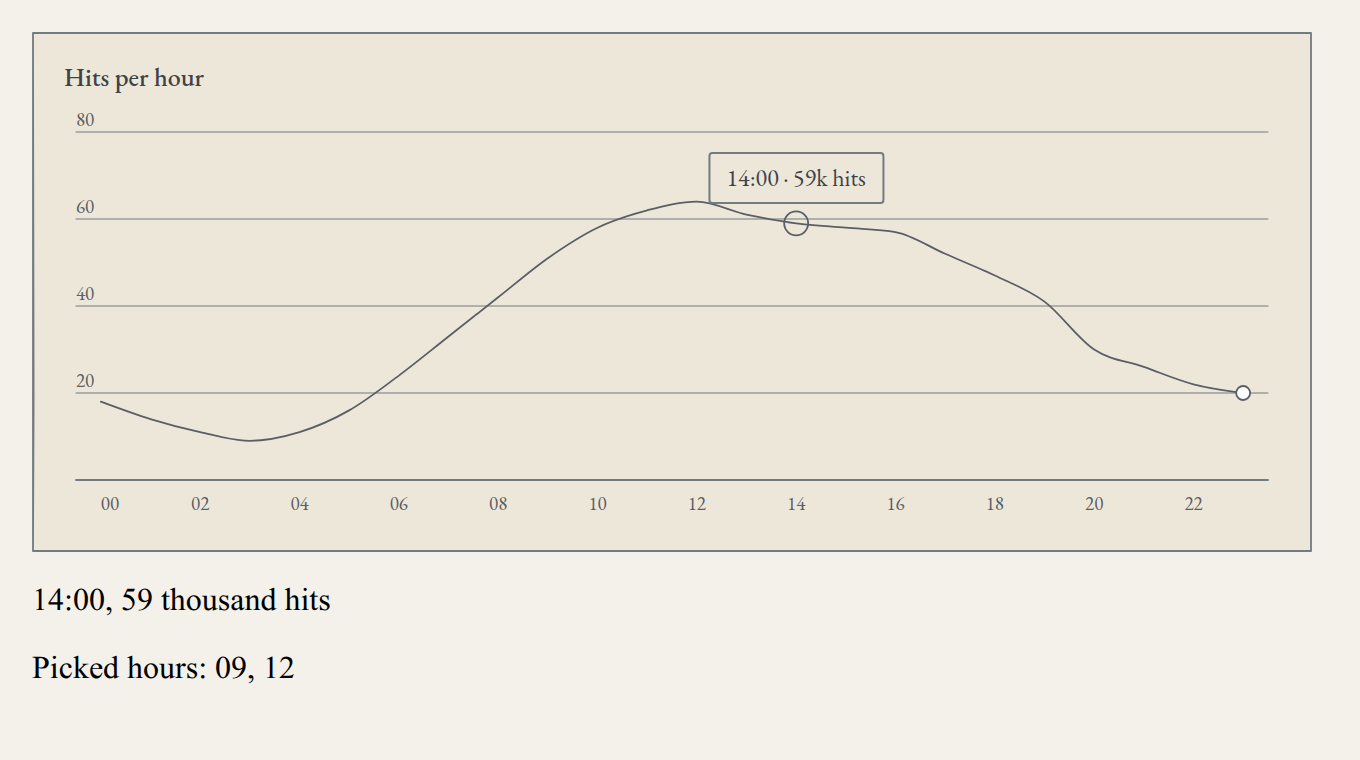
The hits-per-hour chart of the operations panel with three additions: a line of text below the chart that tells the active hour and its hits, a list of hours selected with a click or with the keyboard, and a tooltip of your own in place of the one the chart brings.
What you need
Your framework's project from articles 03 to 06, with the hits per hour from its own-data step: src/traffic.ts in React and Vue, src/app/traffic.ts in Angular and ops_panel/traffic.py in Reflex. First it is built in React, step by step; then, the complete version in Vue, Angular and Reflex.
The two events
| React | Vue | Angular | Reflex | When |
|---|---|---|---|---|
onActiveChange | @active-change | (activeChange) | on_active_change | The active element changes, with the pointer or with the keyboard |
onSelect | @select | (select) | on_select | A click, Enter or space on an element |
Both receive the same object, an ActiveItem. When passing over hour 01 of the hits chart, this arrives:
{"seriesKey":"hits","index":1,"datum":{"hour":"01","hits":14},"value":14,"point":{"x":59.25,"y":193.55}}| Field | What it is |
|---|---|
seriesKey | The element's series: the field that valueKey reads |
index | The position of the row in data |
datum | The whole row, just as you passed it |
value | The drawn value |
point | The position of the element in SVG coordinates, not screen ones |
onActiveChange receives null when there is no active element: when the pointer leaves the chart, when Escape is pressed or when the chart loses focus. In the charts that compute what they draw, such as the histogram, datum is not one of your rows but a summary: the bin and its count, for example. Article 14 walks through them.
1. A readout next to the chart
Replace src/App.tsx:
import { useState } from 'react';
import type { ActiveItem } from '@silverpoint/core';
import { LineChart } from '@silverpoint/react/line-chart';
import { traffic } from './traffic';

export default function App() {
  const [active, setActive] = useState<ActiveItem | null>(null);

  return (
    <main style={{ maxWidth: 640 }}>
      <LineChart
        id="hits"
        data={traffic}
        xKey="hour"
        valueKey="hits"
        title="Hits per hour"
        height={200}
        onActiveChange={setActive}
      />
      <p>
        {active
          ? `${active.datum.hour}:00, ${active.value} thousand hits`
          : 'Point at an hour, or focus the chart and use the arrow keys.'}
      </p>
    </main>
  );
}
The state keeps the last active element and the paragraph writes it. Move the pointer along the line, or reach the chart with Tab and walk it with the arrows: the paragraph changes the same way in both cases. On arriving with Tab, the chart activates the first element.
ActiveItem is a type of the engine, @silverpoint/core, which is installed with the adapter. The import is type-only and adds nothing to the bundle. If you use pnpm, declare @silverpoint/core in your package.json, as article 02 explained.
2. A selection and a tooltip of your own
Replace src/App.tsx with the complete version:
import { useState } from 'react';
import type { ActiveItem } from '@silverpoint/core';
import { LineChart } from '@silverpoint/react/line-chart';
import { traffic } from './traffic';

export default function App() {
  const [active, setActive] = useState<ActiveItem | null>(null);
  const [picked, setPicked] = useState<string[]>([]);

  const toggle = (item: ActiveItem) => {
    const hour = String(item.datum.hour);
    setPicked((hours) => (hours.includes(hour) ? hours.filter((h) => h !== hour) : [...hours, hour]));
  };

  return (
    <main style={{ maxWidth: 640 }}>
      <LineChart
        id="hits"
        data={traffic}
        xKey="hour"
        valueKey="hits"
        title="Hits per hour"
        height={200}
        onActiveChange={setActive}
        onSelect={toggle}
        tooltip={(item) => (
          <span>
            {String(item.datum.hour)}:00 · {item.value}k hits
          </span>
        )}
      />
      <p>
        {active
          ? `${active.datum.hour}:00, ${active.value} thousand hits`
          : 'Point at an hour, or focus the chart and use the arrow keys.'}
      </p>
      <p>Picked hours: {picked.length > 0 ? picked.join(', ') : 'none'}</p>
    </main>
  );
}onSelecttoggles the hour in the list. A click,Enteror space on an hour adds it; another removes it. The chart neither stores nor draws the selection: it is your application's state, and you decide what to do with it.tooltipreplaces the readout. It is a function that receives the active element and returns what is painted inside the box. The position, the marker and the box are still the chart's. The function receives a second argument with the readout the chart would have written (headingandtext), in case you want to start from it.
The custom tooltip only changes what is seen. It is marked aria-hidden, and what the screen reader announces is still the chart's text, "hour 14, hits 59", computed the same way as the data table.
In Vue
Replace src/App.vue:
<script setup lang="ts">
import { ref } from 'vue';
import { SpLineChart, type ActiveItem } from '@silverpoint/vue/line-chart';
import { traffic } from './traffic';

const active = ref<ActiveItem | null>(null);
const picked = ref<string[]>([]);

function toggle(item: ActiveItem) {
  const hour = String(item.datum.hour);
  picked.value = picked.value.includes(hour)
    ? picked.value.filter((h) => h !== hour)
    : [...picked.value, hour];
}
</script>

<template>
  <main style="max-width: 640px">
    <SpLineChart
      id="hits"
      :data="traffic"
      x-key="hour"
      value-key="hits"
      title="Hits per hour"
      :height="200"
      @active-change="active = $event"
      @select="toggle"
    >
      <template #tooltip="{ active: item }">
        <span>{{ item.datum.hour }}:00 · {{ item.value }}k hits</span>
      </template>
    </SpLineChart>
    <p v-if="active">{{ active.datum.hour }}:00, {{ active.value }} thousand hits</p>
    <p v-else>Point at an hour, or focus the chart and use the arrow keys.</p>
    <p>Picked hours: {{ picked.length > 0 ? picked.join(', ') : 'none' }}</p>
  </main>
</template>
The events are listened to with @active-change and @select, and $event is the ActiveItem, or null when there is no active element. The tooltip is a named slot, #tooltip, that receives active and readout. Here active is renamed to item so it is not confused with the component's variable. In Vue, the ActiveItem type is imported from the same entry as the chart.
In Angular
Replace src/app/app.ts:
import { Component, signal } from '@angular/core';
import { SpTooltip } from '@silverpoint/angular';
import { SpLineChart, type ActiveItem } from '@silverpoint/angular/line-chart';
import { traffic } from './traffic';

@Component({
  selector: 'app-root',
  imports: [SpLineChart, SpTooltip],
  template: `
    <main style="max-width: 640px">
      <sp-line-chart
        id="hits"
        [data]="traffic"
        xKey="hour"
        valueKey="hits"
        title="Hits per hour"
        [height]="200"
        (activeChange)="active.set($event)"
        (select)="toggle($event)"
      >
        <ng-template spTooltip let-item>
          <span>{{ item.datum['hour'] }}:00 · {{ item.value }}k hits</span>
        </ng-template>
      </sp-line-chart>
      @if (active(); as item) {
        <p>{{ item.datum['hour'] }}:00, {{ item.value }} thousand hits</p>
      } @else {
        <p>Point at an hour, or focus the chart and use the arrow keys.</p>
      }
      <p>Picked hours: {{ picked().length > 0 ? picked().join(', ') : 'none' }}</p>
    </main>
  `,
})
export class App {
  protected readonly traffic = traffic;
  protected readonly active = signal<ActiveItem | null>(null);
  protected readonly picked = signal<string[]>([]);

  protected toggle(item: ActiveItem) {
    const hour = String(item.datum['hour']);
    this.picked.update((hours) =>
      hours.includes(hour) ? hours.filter((h) => h !== hour) : [...hours, hour],
    );
  }
}
The events are outputs, (activeChange) and (select). The tooltip is a template marked with the spTooltip directive, imported from @silverpoint/angular; let-item receives the active element.
Note item.datum['hour']. The project the Angular CLI creates turns on noPropertyAccessFromIndexSignature in tsconfig.json, and datum is a record with string keys, so its fields are read with brackets. With item.datum.hour, the build fails with "Property 'hour' comes from an index signature, so it must be accessed with ['hour']".
In Reflex
Replace ops_panel/ops_panel.py:
import reflex as rx
from reflex_silverpoint_react import line_chart, tooltip_template

from .traffic import TRAFFIC


class InteractionState(rx.State):
    active: str = ""
    picked: list[str] = []

    @rx.event
    def show(self, item: dict | None):
        if item is None:
            self.active = ""
        else:
            self.active = f"{item['datum']['hour']}:00, {item['value']} thousand hits"

    @rx.event
    def toggle(self, item: dict):
        hour = str(item["datum"]["hour"])
        if hour in self.picked:
            self.picked = [h for h in self.picked if h != hour]
        else:
            self.picked = [*self.picked, hour]

    @rx.var
    def picked_text(self) -> str:
        return ", ".join(self.picked) if self.picked else "none"


def index() -> rx.Component:
    return rx.box(
        line_chart(
            id="hits",
            data=TRAFFIC,
            x_key="hour",
            value_key="hits",
            title="Hits per hour",
            height=200,
            on_active_change=InteractionState.show,
            on_select=InteractionState.toggle,
            tooltip=tooltip_template("{datum.hour}:00 · {value}k hits"),
        ),
        rx.text(
            rx.cond(
                InteractionState.active,
                InteractionState.active,
                "Point at an hour, or focus the chart and use the arrow keys.",
            )
        ),
        rx.text("Picked hours: ", InteractionState.picked_text),
        max_width="640px",
        padding="32px",
    )


app = rx.App()
app.add_page(index)
In Reflex, the handlers receive the ActiveItem as a dictionary: item["datum"]["hour"] reads the field of the row. show receives None when there is no active element, which is why its argument is dict | None.
The tooltip is built with tooltip_template, from a text with placeholders:
| Placeholder | What it writes |
|---|---|
{datum.<field>} | A field of the active row, such as {datum.hour} |
{value} | The drawn value |
{index} and {series} | The position of the row and the series |
{heading} and {text} | The two lines of the chart's readout |
{announcement} | The sentence that is announced |
There is one difference from the other three frameworks. tooltip_template becomes a JavaScript function and runs in the browser, but on_active_change and on_select are backend events: each change of the active element travels over the Reflex WebSocket and comes back with the new state. For a readout next to the chart that is fine. If you only need to change the text of the box, use tooltip_template and not on_active_change.
Common problems
- The paragraph does not change when using the keyboard. The chart does not have focus. Reach it with
Tabbefore using the arrows. - The custom tooltip does not appear in Vue. The slot is called
tooltipand goes inside the chart component:<template #tooltip="{ active }">. - The Angular template is ignored.
SpTooltipis missing fromimports, or the template does not carry thespTooltipattribute. - In TypeScript,
active.datum.houris not a string.datumis a record with values of typeunknown. Convert it withString(...)before showing it in JSX or comparing it.
What comes next
Article 12 changes the colours: the six bundled palettes, a checked palette of your own and a theme switcher for the whole panel.