Articles 23 to 26 build the same application with silverpoint in four frameworks: React with Next.js, Vue, Angular and Reflex. The three pages are the same, with the same data and the same checks in the browser. That makes it possible to compare them with numbers.
This article does not pick a winner. Every figure depends on decisions that are not silverpoint's: the bundler, server rendering or where the state lives. What is useful is knowing what each thing costs and why.
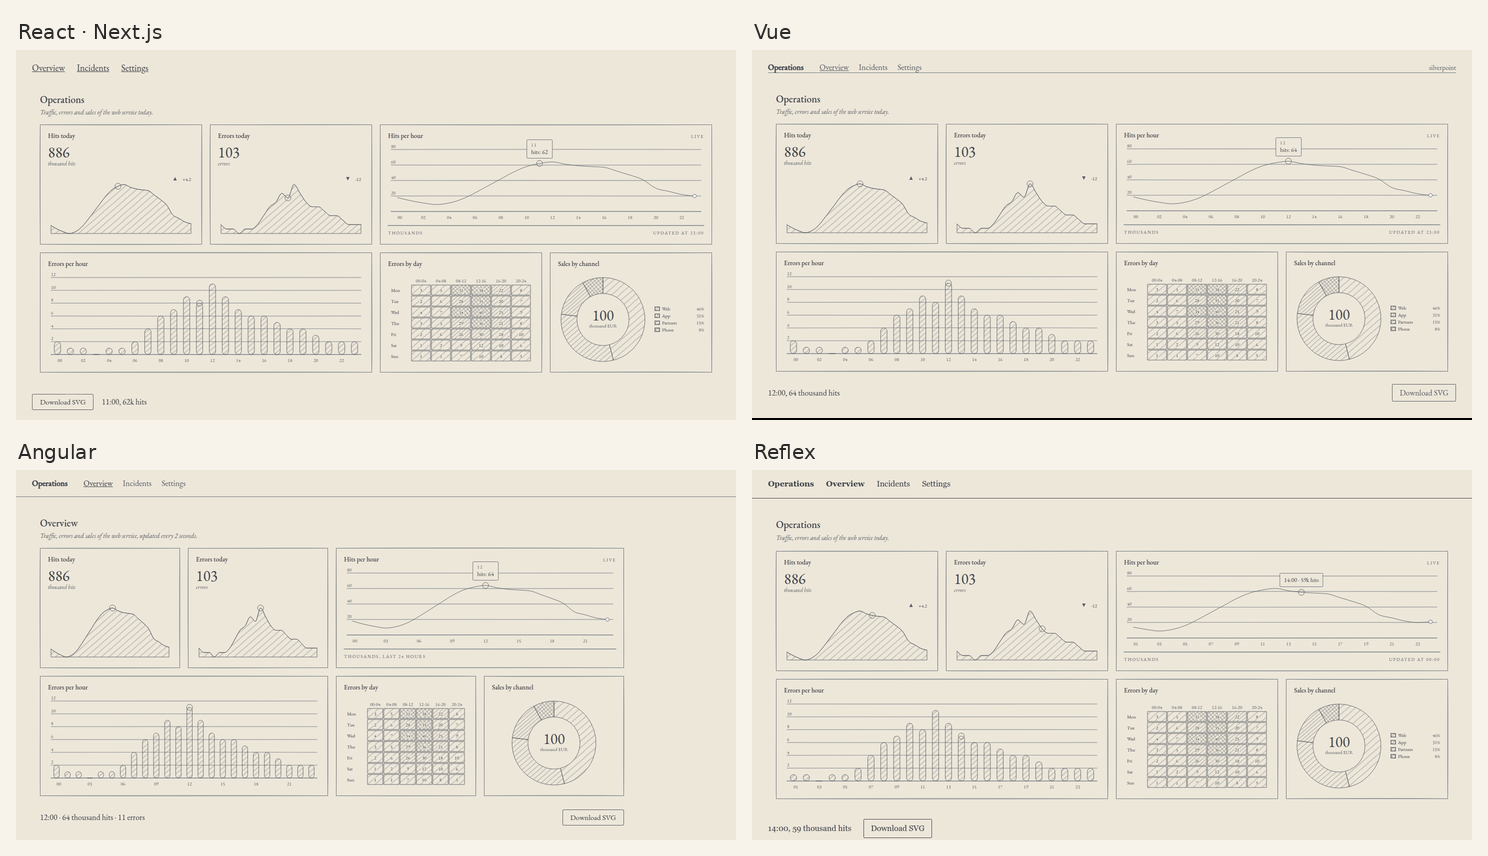
At the top, React with Next.js and Vue. At the bottom, Angular and Reflex. They are real screenshots of each project, with the pointer on an hour of the hits chart. Reflex has one more chart, below what is visible: the response times, measured for real.
What each article builds
| Article | Framework | Project |
|---|---|---|
| 23 | React with Next.js 16 | App Router, Turbopack, prerendered pages |
| 24 | Vue 3 | Vite and vue-router |
| 25 | Angular 22 | CLI, router, standalone components and signals |
| 26 | Reflex 0.11 | Python, with real response times measured by the backend |
The three pages:
- Overview. The dashboard with two indicators, the hits per hour live, the errors per hour linked by
hour, the heatmap of errors by day and the donut of sales by channel. Below, the active hour and the button that downloads the hits chart as SVG. - Incidents. The 12 incidents from article 17 in a sortable, paginated table, with the modal to acknowledge them and the toast.
- Settings. The alert rule form from article 16 and the theme: a palette and a cyanotype switch that change the whole application.
The three JavaScript ones use silverpoint 0.10.1. Reflex uses reflex-silverpoint-react 0.10.0, which brings its own copy of @silverpoint/react 0.10.0.
The same dashboard in four syntaxes
The Overview dashboard is the same component in all four. In React:
<Dashboard
  id="ops"
  title="Operations"
  description="Traffic, errors and sales of the web service today."
  layout={layout}
  link={{ key: 'hour' }}
  ground={settings.ground}
  palette={palette}
>
In Vue:
<SpDashboard
  id="ops"
  title="Operations"
  description="Traffic, errors and sales of the web service today."
  :layout="layout"
  :link="{ key: 'hour' }"
>
In Angular:
<sp-dashboard
  id="ops"
  title="Overview"
  description="Traffic, errors and sales of the web service, updated every 2 seconds."
  [layout]="layout"
  [link]="{ key: 'hour' }"
>
And in Reflex, the keyword arguments at the end of the call to dashboard(...):
id="ops",
title="Operations",
description="Traffic, errors and sales of the web service today.",
layout=LAYOUT,
link="hour",
Only React passes ground and palette to the dashboard. Since 0.10.0, the dashboard's frame follows the provider, as its charts do (silverpoint#17), so Vue, Angular and Reflex pass it nothing. In Next.js the two values are still needed for another reason: the overview is hidden when you change the theme in /settings, and without them its charts took about 2 seconds to take the new theme on return. Article 23 explains it.
How much code
Non-blank lines I wrote, comments included. The files each template generates do not count, nor does the series data, which is the same in all four:
| React · Next.js | Vue | Angular | Reflex | |
|---|---|---|---|---|
| Own code | 494 | 466 | 567 | 609 |
| With the data | 570 | 542 | 643 | 670 |
| Code files | 15 | 12 | 12 | 10 |
The four figures are close. What separates them:
- Vue is the shortest.
v-modelworks with every silverpoint control, and a module-levelreactive()is enough as a store. - Angular writes the template and the styles inside each component, so its lines include them.
- Reflex does a bit more: 46 lines measure the response times of three real sites with httpx, and the dashboard shows a seventh chart with them. Without that, it comes to about 560.
- React splits the code between server and client components. Each page is a small server file that mounts a client component.
- With 0.10, the three JavaScript ones lost code: the code that put the stylesheet inside the SVG and the rule that aligned the table are no longer needed. React went from 514 to 494 lines, Vue from 473 to 466 and Angular from 582 to 567. Reflex stayed the same: the lines it saved in the download it gained in the table rules for the production build.
The dependencies
| Added on top of the template | |
|---|---|
| React · Next.js | @silverpoint/react, @silverpoint/core, @silverpoint/grounds, @silverpoint/fonts |
| Vue | vue-router and @silverpoint/core |
| Angular | @silverpoint/core |
| Reflex | reflex, reflex-silverpoint-react and httpx |
None needed a state library. In Vue and Angular, @silverpoint/core was already installed as a dependency of the adapter; it is declared because the application imports its palettes and its types.
How much it weighs
All the JavaScript of the production build, compressed with gzip. I convert every figure to kB (1000 bytes), because each project measured them with its own tool:
| JS (gzip) | CSS (gzip) | Prerendered | |
|---|---|---|---|
| React · Next.js | 245 kB | 16 kB | Yes, with the charts drawn |
| Vue | 97 kB | 16 kB | No |
| Angular | 161 kB | 15 kB | No |
| Reflex | 221 kB | 17 kB | Yes, with the charts drawn |
What explains the differences:
- Next.js carries its own router and React. With silverpoint 0.9.2 it weighed 327 kB: the provider was imported from the general entry of
@silverpoint/react, which contains the 60 charts, and Turbopack did not drop the unused ones (silverpoint#21). With 0.10.1 it came down to 245 kB. - Vue with Vite drops the charts you do not use and splits each page into its own file. The first visit to
/downloads about 98 kB with the CSS. - Angular loads each page separately with
loadComponent. The first visit to/downloads about 157 kB with the CSS. - Reflex adds its state client and the socket that connects it to the backend.
The CSS is almost the same in all four: it is mostly the grounds' stylesheet and the components' one. The three EB Garamond fonts add another 75 kB.
How long it takes
On my machine, locally, without throttling the network. Median of three measurements:
| Production build | Development server, cold | First chart ready (production) | |
|---|---|---|---|
| React · Next.js | 7.6 s | 3.8 s until it serves the first page | 25 ms |
| Vue | 3.4 s | 0.3 s until ready | 288 ms |
| Angular | 4 s | 3.2 s until it serves the first page | 235 ms |
| Reflex | 3.7 s | 2.7 s until frontend and backend answer | 294 ms |
- Next.js's first chart arrives drawn in the HTML. Inside
Dashboard, client charts get their size from the cell, so the static prerender draws them. Vue and Angular draw them in the browser.reflex exportprerenders them too, except the response-time one, which waits for the backend; Reflex's 294 ms were measured withreflex run --env prod. - Vite starts almost instantly because it compiles nothing until you ask for a page. Its first page takes a little longer.
- Reflex takes about 1 s to draw in development. In production it drops to 294 ms.
The figures are for comparing with each other, not a promise: on a real network size weighs more than local time. I measured them with silverpoint 0.9.2. With 0.10 I repeated them, and the difference between versions stayed within the noise of the measurement. The exception is the start of ng serve, a little faster because it prebundles the dependencies again.
Where the state lives
| The theme and the rule | The live window | When changing page | |
|---|---|---|---|
| React · Next.js | A client context in the shared layout | An interval in the page | Next keeps the last three pages hidden; the window pauses and resumes |
| Vue | A module-level reactive() | An interval in the page | The page unmounts; the window starts over |
| Angular | Root services with signals | A root service | The window keeps running |
| Reflex | The state on the server, per tab | A background task | Reflex cancels the task and launches it again on return |
Next.js hides the pages you leave with display: none. Up to 0.9.2, in development their charts measured 0 px and warned with SP003 although nothing was wrong. Since 0.10.0, a hidden chart keeps its last width and does not warn (silverpoint#22).
The theme across the application
The provider colours silverpoint's charts and components, but not the page: it adds no element to the DOM. All four handle the page's background and text on their own, with the same --sp-* properties:
| The provider that changes | The page background | |
|---|---|---|
| React · Next.js | SilverpointProvider with values from the context | paletteStyle as a style object |
| Vue | SilverpointProvider with reactive values | paletteStyle on an element of its own |
| Angular | Its own SILVERPOINT_CONFIG, with getters that read signals | The ground's class and paletteStyle |
| Reflex | silverpoint_provider with state variables | Colours computed in the state |
Angular is the hard case: provideSilverpoint receives a fixed object. Article 25 solves it by providing SILVERPOINT_CONFIG with getters, something silverpoint's documentation does not cover.
The easiest and the hardest in each
| The easiest | The hardest | |
|---|---|---|
| React · Next.js | Prerendered pages with the charts drawn, and the state is kept when navigating | The theme when coming back from a hidden page: the dashboard needs ground and palette so that its charts change together with the frame |
| Vue | v-model on every control, aria-current for free on RouterLink | Painting the page in cyanotype, which has no palette of its own |
| Angular | Services with signals as a store, [(open)] and [(value)] straight to the signals | The theme in the provider: provideSilverpoint takes a fixed object |
| Reflex | Real data with no API or CORS: the backend already exists | Every interaction is a round trip to the server, and rx.App(style=...) is not applied without RadixThemesPlugin |
Two more silverpoint bugs showed up only in Angular, and 0.10.0 fixed both. Importing the stylesheet as text broke ng serve (silverpoint#19); now the stylesheet is imported from @silverpoint/grounds/styles-text. And the literal text title="…" stayed as an attribute on the element (silverpoint#18). It no longer does, although in Chrome the tooltip still appears: it comes from the SVG's <title> element, which is the chart's accessible name.
Which to choose
silverpoint does not decide for you: the 60 charts, the props and the components are the same in the four adapters, and the dashboard code changes only in syntax.
- If your team already uses one of the four, stay with it. No difference in this table justifies switching frameworks for the charts.
- If page weight matters above everything, Vue with Vite gave the smallest bundle.
- If the first view has to arrive drawn, Next.js prerenders the charts inside a dashboard.
- If the data is in Python, Reflex saves you writing an API: the dashboard reads the backend's state.
What comes next
Article 28 leaves the frameworks and works with AI assistants: silverpoint's MCP server and its skills, with real calls and outputs.