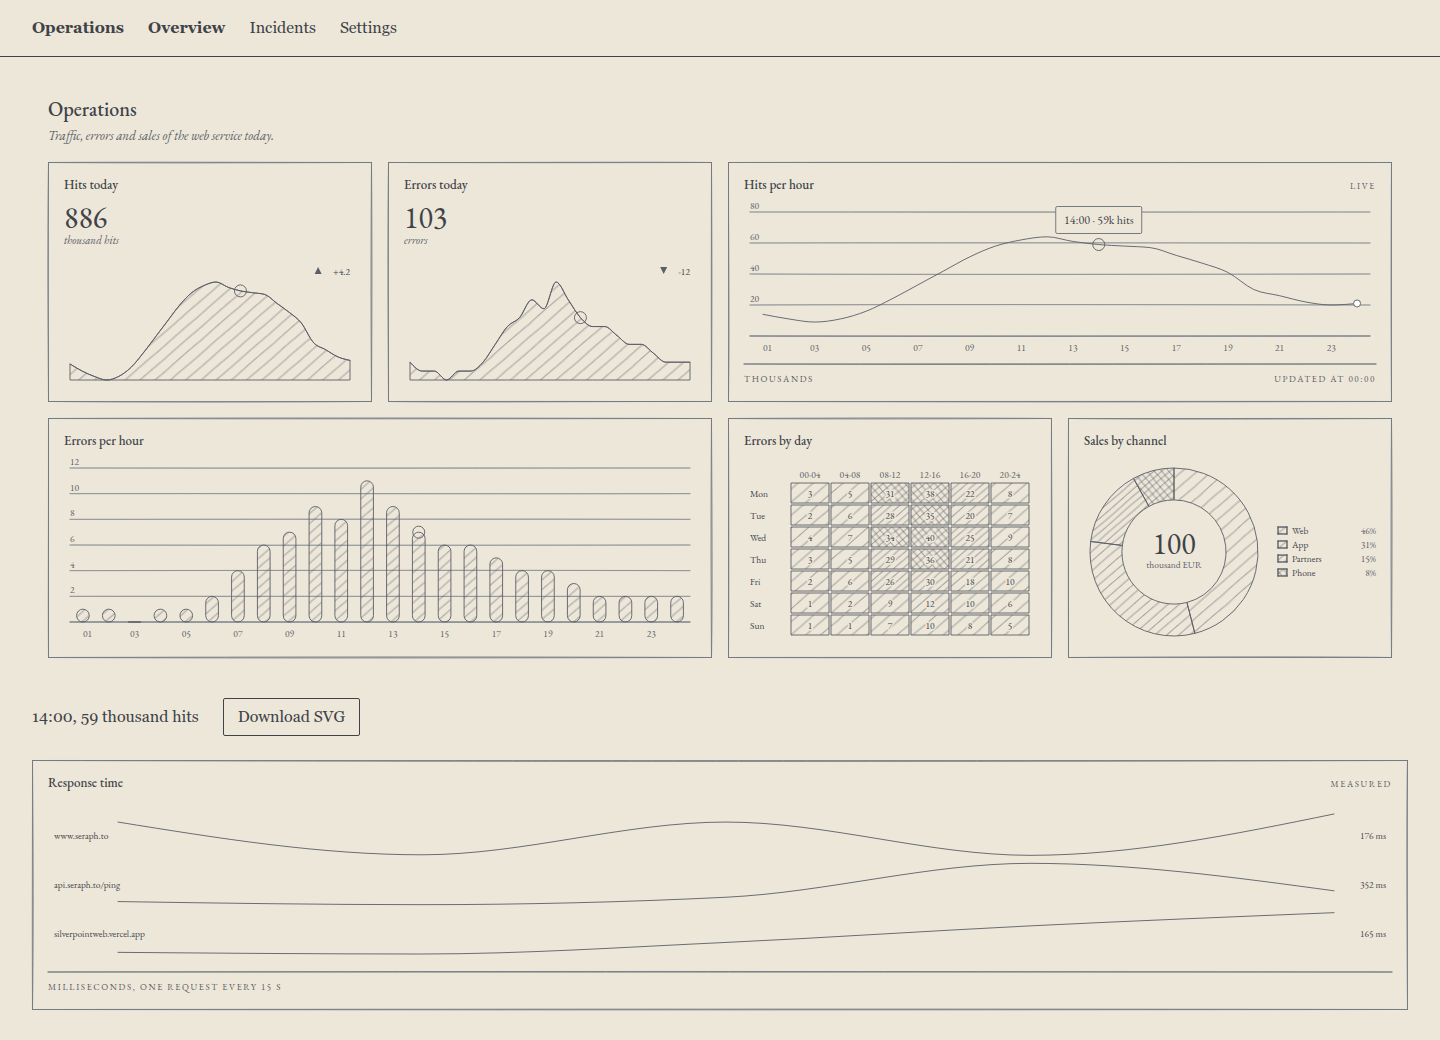
Articles 23, 24 and 25 build the same application, Operations, in React, Vue and Angular. This one builds it in Reflex, without writing JavaScript: the pages, the state and the events are Python, and Reflex compiles the frontend to React.
Reflex has something the other three do not have out of the box: its own backend. That is why this version adds real data. While the application runs, the backend measures the response time of three public addresses and the panel draws it.
What you will build
| Route | Page | What it has |
|---|---|---|
/ | Overview | The dashboard from article 13 with the live hits, the readout of the active hour, the SVG download and the measured response times |
/incidents | Incidents | The incidents table with sorting, pages, the dialog to acknowledge an incident and the toast from article 17 |
/settings | Settings | The alert-rule form from article 16 and the theme: palette and ground |
A navigation bar at the top links the three. The theme you choose in Settings colours the whole application and is kept for as long as the session lasts.
What is real and what is sample data
| Data | Source |
|---|---|
Response times of www.seraph.to, api.seraph.to/ping and silverpointweb.vercel.app | Real. The backend sends one request to each address every 15 seconds and measures how long it takes |
| Hits and errors per hour | Sample: the series' rows, which advance every 2 seconds as in article 20 |
| Hits and errors today, errors by day, sales by channel | Sample: the series' rows |
| The 12 incidents | Sample: the ones from article 17 |
The times are measured from the machine where the backend runs. In my tests they came out between 100 and 350 ms.
What you need
Python 3.13 and uv. The versions I tested it with:
| Package | Version |
|---|---|
reflex | 0.11.0 |
reflex-silverpoint-react | 0.10.0 |
httpx | 0.28.1 |
Create the project as in article 06:
uv init operations
cd operations
uv add reflex reflex-silverpoint-react httpx
uv run reflex init
reflex init creates rxconfig.py and the operations/ module with a welcome page, which this article replaces. Also delete the main.py that uv init creates. The dependencies end up like this in pyproject.toml:
dependencies = [
    "httpx>=0.28.1",
    "reflex>=0.11.0",
    "reflex-silverpoint-react>=0.10.0",
]
The structure
operations/
├── assets/
│   └── operations.css
├── operations/
│   ├── __init__.py
│   ├── data.py
│   ├── incidents.py
│   ├── layout.py
│   ├── live.py
│   ├── operations.py
│   ├── overview.py
│   ├── probes.py
│   ├── settings.py
│   └── theme.py
├── pyproject.toml
└── rxconfig.py| File | What it does |
|---|---|
data.py | The series' sample rows and the 12 incidents, copied from articles 13 and 17 |
probes.py | The real data: it measures the three addresses and keeps the readings |
live.py | The 24-hour window that advances, from article 20 |
theme.py | The session's theme |
layout.py | The navigation and the provider that wraps every page |
overview.py, incidents.py, settings.py | The three pages |
operations.py | The application: stylesheet, background task and routes |
rxconfig.py only keeps the sitemap plugin. I removed the Tailwind and Radix Themes ones, which the application does not use:
import reflex as rx

config = rx.Config(
    app_name="operations",
    plugins=[rx.plugins.SitemapPlugin()],
)
1. The real data
operations/probes.py sends a GET request to each address, measures the time until the full response arrives and keeps the last 40 readings of each one:
"""The real data: the response time of three public endpoints."""

import asyncio
import time
from collections import deque

import httpx

TARGETS = {
    "www.seraph.to": "https://www.seraph.to",
    "api.seraph.to/ping": "https://api.seraph.to/ping",
    "silverpointweb.vercel.app": "https://silverpointweb.vercel.app",
}
INTERVAL = 15  # seconds between rounds: one request per endpoint and round
KEEP = 40  # readings kept per endpoint: the last ten minutes

READINGS: dict[str, deque[dict]] = {name: deque(maxlen=KEEP) for name in TARGETS}


async def measure(client: httpx.AsyncClient, url: str) -> dict:
    """One GET, timed from the request to the last byte of the body."""
    start = time.perf_counter()
    try:
        response = await client.get(url)
    except httpx.HTTPError as error:
        return {"ms": None, "status": type(error).__name__}
    ms = round((time.perf_counter() - start) * 1000)
    return {"ms": ms, "status": response.status_code}


async def probe_forever():
    """Measure every endpoint, wait, repeat; Reflex cancels it on shutdown."""
    headers = {"User-Agent": "operations-demo/0.1"}
    async with httpx.AsyncClient(timeout=10, headers=headers) as client:
        while True:
            for name, url in TARGETS.items():
                READINGS[name].append(await measure(client, url))
            await asyncio.sleep(INTERVAL)


def latency_rows() -> list[dict]:
    """One row per endpoint for sparkline_rows: the points and the last reading."""
    rows = []
    for name, readings in READINGS.items():
        if not readings:
            continue
        last = readings[-1]
        ok = last["status"] == 200
        rows.append(
            {
                "name": name,
                "points": [r["ms"] for r in readings if r["ms"] is not None],
                "readout": f"{last['ms']} ms" if ok else str(last["status"]),
            }
        )
    return rows
probe_forever is not an event of any state. It is an application lifespan task: operations.py registers it with app.register_lifespan_task, Reflex starts it with the backend and cancels it when the backend stops. It runs once per process, whether one or a hundred users open the page. So the pace is always the same: three requests every 15 seconds.
Three details of the measurement:
- The connection is reused.
httpx.AsyncClientkeeps the connections open between rounds. The first reading includes the TLS handshake and the rest do not. Withcurl, which opens a new connection,www.seraph.totakes about 470 ms; with the connection open, about 150 ms. - A failure is a reading too. If the request fails, the name of the error is stored, such as
ConnectTimeout, and the row shows it instead of the milliseconds. - The readings live in memory. A
dequewithmaxlen=40keeps the last ten minutes and drops anything older. They are lost when the backend restarts. To keep them, Reflex offersrx.Modelwith SQLite, which needs thereflex[db]extra; I did not use it here.
Without Redis, Reflex starts the backend with a single process, and that is why there is a single loop. With Redis and several processes, each process would have its own READINGS and its own loop, and the requests would multiply. In that case, move the measurement to a separate process that writes to a database.
2. The session's theme
Article 12 changed the theme of one page. Here it changes the whole application. operations/theme.py stores two decisions, the palette and whether the ground is cyanotype, and derives from them what the components need:
import reflex as rx
from reflex_silverpoint_react import PALETTES

PALETTE_ITEMS = [
    {"key": key, "label": key.replace("_", " ").capitalize()} for key in PALETTES
]
CYANOTYPE_PAGE = {"background": "#1B3F6B", "color": "#F4F6F8"}


class ThemeState(rx.State):
    palette_name: str = "silverpoint"
    cyanotype: bool = False

    @rx.event
    def set_palette_name(self, value: str):
        self.palette_name = value

    @rx.event
    def set_cyanotype(self, value: bool):
        self.cyanotype = value

    @rx.var
    def ground(self) -> str:
        return "cyanotype" if self.cyanotype else "silverpoint"

    @rx.var
    def palette(self) -> dict[str, str]:
        return {} if self.cyanotype else PALETTES[self.palette_name].to_dict()

    @rx.var
    def page(self) -> dict[str, str]:
        if self.cyanotype:
            return CYANOTYPE_PAGE
        colors = PALETTES[self.palette_name].to_dict()
return {"background": colors["substrate"], "color": colors["text"]}| Variable | What for |
|---|---|
ground | The ground of the provider and of the dialog in Incidents |
palette | The palette's colours; empty in cyanotype, which brings its own |
page | The page's background and text colour |
page exists because the provider does not paint the page: it only styles silverpoint's components, as article 12 warned. With cyanotype, the page's background is the ground's Prussian blue, #1B3F6B.
operations/layout.py wraps every page with the navigation and the provider from article 09, with the session's theme:
import reflex as rx
from reflex_silverpoint_react import silverpoint_provider

from .theme import ThemeState

LINKS = [("/", "Overview"), ("/incidents", "Incidents"), ("/settings", "Settings")]


def nav(route: str) -> rx.Component:
    return rx.el.nav(
        rx.el.strong("Operations"),
        *[
            rx.el.a(text, href=href, aria_current="page" if href == route else None)
            for href, text in LINKS
        ],
        class_name="top-nav",
    )


def shell(route: str, *children: rx.Component) -> rx.Component:
    """Every page: the provider with the session's theme, the nav and the content."""
    return silverpoint_provider(
        rx.el.div(
            nav(route),
            rx.el.main(*children),
            class_name="shell",
            style=ThemeState.page,
        ),
        ground=ThemeState.ground,
        palette=ThemeState.palette,
    )
Article 09 wrapped the whole application with app.extra_app_wraps. That does not work here: that wrapper is built once, with no access to the session's state. shell solves it on every page.
Reflex's state lives in the backend, one copy per tab. The bar's links change page without reloading it, so the theme and the Settings form are still there when you come back. They are lost when you close the tab: that is the scope of a session.
3. The Overview page
operations/live.py is the window from article 20, with one difference: every new reading also brings that hour's errors, so that the bar chart advances together with the line:
from .data import HOURLY


def next_reading(last: dict, tick: int) -> dict:
    """The hour after the last one, from the day's profile with a small variation."""
    hour = (int(last["hour"]) + 1) % 24
    return {
        "hour": f"{hour:02d}",
        "hits": HOURLY[hour]["hits"] + (tick * 7) % 9 - 4,
        "errors": HOURLY[hour]["errors"],
    }


def advance(rows: list[dict], tick: int) -> list[dict]:
    """A rolling window: drop the oldest hour and append the new one."""
    return [*rows[1:], next_reading(rows[-1], tick)]
operations/overview.py starts with its imports:
import asyncio

import reflex as rx
from reflex_silverpoint_react import (
    bar_chart,
    dashboard,
    dashboard_cell,
    dashboard_cell_layout,
    dashboard_layout,
    donut_chart,
    download_svg,
    heatmap_chart,
    kpi_card,
    line_chart,
    sparkline_rows,
    tooltip_template,
)

from .data import BLOCKS, ERRORS_BY_DAY, HOURLY, SALES
from .layout import shell
from .live import advance
from .probes import latency_rows
The state of what moves. rows are the sample hits and latency, the rows of the real times:
class LiveState(rx.State):
    rows: list[dict[str, str | int]] = HOURLY
    latency: list[dict] = []

    @rx.var
    def last(self) -> dict[str, str | int]:
        return self.rows[-1]

    @rx.event(background=True)
    async def stream(self):
        async with self:
            self.latency = latency_rows()
        tick = 0
        while True:
            await asyncio.sleep(2)
            tick += 1
            async with self:
                self.rows = advance(self.rows, tick)
                if (latency := latency_rows()) != self.latency:
                    self.latency = latency
stream is the background task from article 20. Every 2 seconds it advances the window and copies the readings from probes.py; it only assigns them if they changed, so as not to send the same thing to the browser every time. The task makes no requests: it reads the process's memory, which the lifespan task fills.
The Overview page's on_load starts it. I checked it in the browser: when going to Incidents with the bar, Reflex cancels the task and no message arrives over the websocket for 6 seconds; when coming back, a new one starts and the window advances one hour every 2 seconds, not two.
The readout of the active hour is the one from article 11 and the download, the one from article 18: download_svg, which since 0.10.0 puts the stylesheet inside the SVG (reflex-silverpoint-react#45). It needs no state:
class ReadoutState(rx.State):
    active: str = ""

    @rx.event
    def show(self, item: dict | None):
        if item is None:
            self.active = ""
        else:
            self.active = f"{item['datum']['hour']}:00, {item['value']} thousand hits"
The dashboard is the one from article 13 with two changes: the line and the bars read LiveState.rows, and the line carries the tooltip and on_active_change:
def panel() -> rx.Component:
    return dashboard(
        dashboard_cell(
            kpi_card(
                title="Hits today",
                data=HOURLY,
                value_key="hits",
                value=886,
                unit="thousand hits",
                delta=4.2,
            ),
            cell="hits-today",
        ),
        dashboard_cell(
            kpi_card(
                title="Errors today",
                data=HOURLY,
                value_key="errors",
                value=103,
                unit="errors",
                delta=-12,
            ),
            cell="errors-today",
        ),
        dashboard_cell(
            line_chart(
                id="hits",
                title="Hits per hour",
                badge="Live",
                data=LiveState.rows,
                x_key="hour",
                value_key="hits",
                footer_left="Thousands",
                footer_right=f"Updated at {LiveState.last['hour']}:00",
                tooltip=tooltip_template("{datum.hour}:00 · {value}k hits"),
                on_active_change=ReadoutState.show,
            ),
            cell="traffic",
        ),
        dashboard_cell(
            bar_chart(
                title="Errors per hour",
                data=LiveState.rows,
                x_key="hour",
                value_key="errors",
            ),
            cell="errors-hour",
        ),
        dashboard_cell(
            heatmap_chart(
                title="Errors by day",
                data=ERRORS_BY_DAY,
                label_key="day",
                values_key="values",
                column_labels=BLOCKS,
                scale_max=40,
            ),
            cell="errors-day",
        ),
        dashboard_cell(
            donut_chart(
                title="Sales by channel",
                data=SALES,
                name_key="channel",
                value_key="sales",
                center_label="thousand EUR",
            ),
            cell="channels",
        ),
        id="ops",
        title="Operations",
        description="Traffic, errors and sales of the web service today.",
        layout=LAYOUT,
        link="hour",
    )
The dashboard does not receive the theme: it takes it from the provider. Since 0.10.0, its paper, its title and its background follow the provider as its charts do (silverpoint#17). Choosing cyanotype turns the frame and the six charts blue at once. Up to 0.9.1 you also had to pass ground and palette to dashboard.
link="hour" links the charts by hour: when you point at 14:00 on the line, the bars and the two cards mark their 14:00 point. The line advances meanwhile; so do the bars, because they read the same rows.
The rest of the page. The real times are drawn with sparkline_rows, one row per address with its curve and the last reading:
def response_times() -> rx.Component:
    return rx.cond(
        LiveState.latency,
        sparkline_rows(
            title="Response time",
            badge="Measured",
            data=LiveState.latency,
            footer_left="Milliseconds, one request every 15 s",
        ),
        rx.el.p("Waiting for the first measurements…"),
    )


def overview() -> rx.Component:
    return shell(
        "/",
        panel(),
        rx.el.div(
            rx.el.p(
                rx.cond(
                    ReadoutState.active,
                    ReadoutState.active,
                    "Point at an hour, or focus the chart and use the arrow keys.",
                ),
                role="status",
            ),
            rx.el.button(
                "Download SVG",
                type="button",
                on_click=download_svg("hits", "hits-per-hour.svg"),
            ),
            class_name="toolbar",
        ),
        response_times(),
    )
rx.cond is there because sparkline_rows with an empty list draws its empty state, «No data». Until the first round of measurements arrives, the page says it is waiting.
4. The Incidents page
operations/incidents.py is the code from article 17: the columns, IncidentsState, the table, the pagination, the dialog and the toast. Two things change. The end puts the section inside shell:
def incidents() -> rx.Component:
    return shell("/incidents", incidents_table())
And the dialog receives the theme, with from .theme import ThemeState among the imports:
        sp_modal(
            sp_select(
                IncidentsState.open_ids,
                label="Incident",
                placeholder="Choose an open incident",
                value=IncidentsState.picked,
                on_change=IncidentsState.set_picked,
            ),
            trigger="Acknowledge an incident",
            title="Acknowledge an incident",
            description="The on-call team stops being paged for it.",
            footer=sp_button(
                "Acknowledge",
                variant="primary",
                disabled=IncidentsState.picked.is_none(),
                on_click=IncidentsState.acknowledge,
            ),
            open=IncidentsState.open,
            on_open_change=IncidentsState.set_open,
            ground=ThemeState.ground,
            palette=ThemeState.palette,
        ),
The trigger is a text, which sp_modal turns into a button drawn with sp_trigger. That button does not read the provider: without ground and palette on the dialog, with cyanotype it keeps its dark text on the blue background and can hardly be seen. With them, the trigger follows the theme. Up to 0.9.1, a text in trigger with the dialog controlled from the state broke the page (reflex-silverpoint-react#44).
5. The Settings page
operations/settings.py starts with the form from article 16, RuleState and alert_rule_form, unchanged. Then it adds the theme card and the page:
def theme_settings() -> rx.Component:
    return sp_card(
        sp_select(
            PALETTE_ITEMS,
            label="Palette",
            value=ThemeState.palette_name,
            on_change=ThemeState.set_palette_name,
            disabled=ThemeState.cyanotype,
        ),
        sp_switch(
            label="Cyanotype ground",
            checked=ThemeState.cyanotype,
            on_change=ThemeState.set_cyanotype,
        ),
        line_chart(
            title="Preview",
            data=HOURLY,
            x_key="hour",
            value_key="hits",
            height=120,
        ),
        title="Theme",
    )


def settings() -> rx.Component:
    return shell(
        "/settings",
        rx.el.div(alert_rule_form(), theme_settings(), class_name="columns"),
    )
The palette is chosen with sp_select among the six in PALETTES, and the ground with sp_switch. With cyanotype on, the select is disabled: that ground brings its own colours. The preview is a small line chart that changes with the theme.
6. The application
operations/operations.py puts it all together:
import reflex as rx

from .incidents import incidents
from .overview import LiveState, overview
from .probes import probe_forever
from .settings import settings

app = rx.App(stylesheets=["/operations.css"])
app.register_lifespan_task(probe_forever)
app.add_page(overview, route="/", title="Operations", on_load=LiveState.stream)
app.add_page(incidents, route="/incidents", title="Incidents · Operations")
app.add_page(settings, route="/settings", title="Settings · Operations")
The style rules go in assets/operations.css. Those for the bar and the columns are layout; these are the ones for the table and the download button:
/* SpTable fills the width of its section */
.sp-ui.sp-table {
  justify-self: stretch;
  margin-top: 0;
  font-size: 15px;
}

/* In the production build the charts' stylesheet loads after the components' one, and its
   .sp-table rules, written for the charts' data table, win over SpTable's own */
.sp-ui .sp-ui-table th {
  padding: 8px 14px;
  border-bottom: 1px solid var(--sp-ink);
}

.sp-ui .sp-ui-table td {
  padding: 8px 14px;
  border-bottom: 1px solid var(--sp-grid);
}

.sp-ui .sp-ui-table :is(th, td):not([data-align]) {
  text-align: start;
}

/* A plain button: the SVG download */
.toolbar button {
  padding: 6px 14px;
  border: 1px solid currentColor;
  border-radius: 2px;
  background: transparent;
  color: inherit;
  font: inherit;
  cursor: pointer;
}
The table rules are needed because of the production build. 0.10.0 fixed the alignment of sp_table cells (silverpoint#12), and in development the table looks right with no rule. But the fix depends on the components' stylesheet loading after the charts' one. In this application, with three pages, the production build links them the other way round: without these rules, the cells and the headers came out right-aligned, with less padding and smaller type. With them, the table measures the same in development and in production. It does not happen in the single-page application of article 17.
They go in a file for a practical reason. In article 17 the rules went in rx.App(style=...). Without the RadixThemesPlugin plugin, those rules do not reach the page, not in Reflex 0.11.0 either. With stylesheets the stylesheet always arrives.
Run, build and deploy
In development:
uv run reflex runThe frontend is at http://localhost:3000 and the backend, with the measurement task, on port 8000. To try production mode on your machine:
uv run reflex run --env prodIn production, frontend and backend share one port. If you give them two different ones, Reflex refuses to start with «In prod mode, frontend and backend must run on the same port».
There are two ways to deploy:
| Way | How |
|---|---|
| Split | uv run reflex export --frontend-only generates the static frontend, which any file host can serve. The backend runs on a server with uv run reflex run --env prod --backend-only, and api_url in rxconfig.py tells the frontend where it is |
| Reflex Cloud | uv run reflex deploy uploads the application to Reflex's hosting |
This blog uses the first way: the static frontend is on Vercel and the backend, in a container. I did not deploy Operations; I tried production mode and the export locally. With the split way, the response times are measured from the backend's server, not from the browser of whoever is looking.
The checks
All the code in this article is the tested project's. With headless Chrome, from Playwright, in development and again with --env prod:
| What | Result |
|---|---|
| The seven charts of Overview | data-status="ready" |
| Live | The line's footer goes from «Updated at 23:00» to «Updated at 01:00» in 4 seconds |
| Active hour | On hover, the readout says «14:00, 59 thousand hits» and the tooltip, «14:00 · 59k hits» |
| Link by hour | The bars draw their link mark (part="linked") |
| Real times | Three rows with their reading, such as «154 ms» |
| Download | hits-per-hour.svg, about 12.4 KB, with one <![CDATA[ block holding the page's silverpoint rules; opened alone, it shows its colours |
| Navigation | No websocket message for 6 seconds on Incidents; on returning, one hour every 2 seconds |
| Incidents | Sorting by minutes both ways, page 2, acknowledging INC-1042 closes the dialog and opens the toast, the row becomes acknowledged, cells and headers aligned to the start in development and in production |
| Form | «hits ≥ 15, by chat, paused. Notes: Page the API team» |
| Theme | With Sanguine the background becomes #F2E8DC; with cyanotype, #1B3F6B, and the Overview dashboard and the Incidents components follow it |
| Session | On returning to Settings, the form and the switch keep their value |
| Console | No errors |
Also, ruff format and ruff check on the project. With ruff 0.17's default rules, ruff check only flags RUF012 on latency: list[dict] = []. In a Reflex state that is the normal way to declare a variable: Reflex copies the initial value for each session.
The figures
Measured on my machine, to compare them in article 27:
| Measure | Value |
|---|---|
| Code written | 9 Python modules, one CSS sheet and rxconfig.py: 670 non-blank lines; about 270 are the code from articles 13, 16 and 17 unchanged |
| Dependencies added | reflex, reflex-silverpoint-react, httpx |
reflex export --frontend-only | 3.7 s |
| Exported JavaScript | 16 files, 669 KB; 216 KB with gzip |
| Exported CSS | 4 files, 155 KB; 17 KB with gzip |
Start of reflex run | 2.7 s until frontend and backend answer; 3.3 s without .web/ |
| First chart ready | 294 ms in production, 1,049 ms in development (median of 3) |
Common problems
- The dashboard stays cream with cyanotype. You have
reflex-silverpoint-reactbefore 0.10.0, where the dashboard did not read the provider. Update the package. - The button that opens the dialog can hardly be seen with cyanotype. The text trigger does not read the provider. Pass
groundandpalettetosp_modal. - In production, the table comes out right-aligned and cramped. The table rules of
operations.cssare missing. In development it does not show. - The page does not change colour. The provider only styles silverpoint's components. The background comes from
ThemeState.pageinshell. - The rules in
rx.App(style=...)are not applied. WithoutRadixThemesPluginthey do not reach the browser. Use a stylesheet inassets/andstylesheets. - The response times say «No data» at startup.
sparkline_rowsgot an empty list before the first round. Put the chart behindrx.cond. - The requests multiply. There are several backend processes, each with its own lifespan task. Measure from a single process.
What comes next
The Operations application now exists in four frameworks. Article 27 puts them side by side: how much code each one takes, how much it weighs and what turned out easier or harder in each framework.