In the previous article I showed how to create graphs from the contents of a file, and the first one explains the basics of creating graphs; this one covers analyzing graphs and extracting information from them.
The example below creates a graph with several nodes (from "a" to "z") and links all the nodes. It then shows the number of nodes and the number of relationships between nodes, assigns an attribute to a node and an attribute between 2 nodes, finds the neighbors of a node, and gets the value of a node's attribute and of the attribute between 2 nodes. It also shows the shortest path to get from node m to b, the average shortest path, the relationship of the nodes with respect to m, and the shortest path between m and b using Dijkstra's Algorithm. To finish, the graph is drawn with several methods (spectral, random, circular and normal).
Here is the code:
#!/usr/bin/env python

import networkx as net

#Se importa la libreria pyplot de matplotlib como plt

import matplotlib.pyplot as plt

#Se crea la instancia vacia del grafo

g=net.Graph()

#Se crean los nodos con sus relaciones

g.add_edge('a','b')

g.add_edge('b','c')

g.add_edge('c','a')

g.add_edge('a','d')

g.add_edge('f','d')

g.add_edge('g','f')

g.add_edge('h','b')

g.add_edge('i','h')

g.add_edge('i','g')

g.add_edge('j','c')

g.add_edge('k','j')

g.add_edge('l','k')

g.add_edge('m','l')

g.add_edge('k','h')

g.add_edge('i','d')

g.add_edge('f','k')

g.add_edge('m','g')

g.add_edge('n','m')

g.add_edge('o','m')

g.add_edge('p','o')

g.add_edge('q','h')

g.add_edge('r','q')

g.add_edge('s','r')

g.add_edge('t','a')

g.add_edge('u','t')

g.add_edge('v','u')

g.add_edge('j','b')

g.add_edge('w','f')

g.add_edge('x','w')

g.add_edge('y','i')

g.add_edge('z','y')

g.add_edge('n','p')

g.add_edge('z','x')

g.add_edge('z','v')

g.add_edge('s','x')

g.add_edge('p','v')

g.add_edge('r','u')


print "Nodos: ",g.nodes()

print "Relaciones: ",g.edges()


#Se define un tamagno al nodo a y un peso a la relacion entre el nodo a y b

g.node['a']['size']=1

g['a']['b']['weight']=1


print "Vecinos de m: ", g.neighbors('m')

print "Valor del nodo a: ",g['a']

print "Peso de la relacion entre a y b: ", g['a']['b']


print "Ruta mas corta entre m y b: ",net.algorithms.shortest_path(g,'m','b')

print "Promedio de la ruta mas corta ",net.algorithms.average_shortest_path_length(g)

print "Muestra la relacion de ruta mas corta entre pares de nodos relacionado con m: ", net.algorithms.all_pairs_shortest_path(g)['m']

print "Ruta mas corta usando el algoritmo de Dijkstra entre m y b:",net.algorithms.dijkstra_path(g, 'm', 'b')

#Se dibuja el grafo

net.draw(g)

#net.draw_spectral(g)

#net.draw_circular(g)

#net.draw_random(g)

#Se muestra el grafico

plt.show()
To generate the graph in spectral, circular or random form, comment out the previous one and uncomment the one you want to generate.
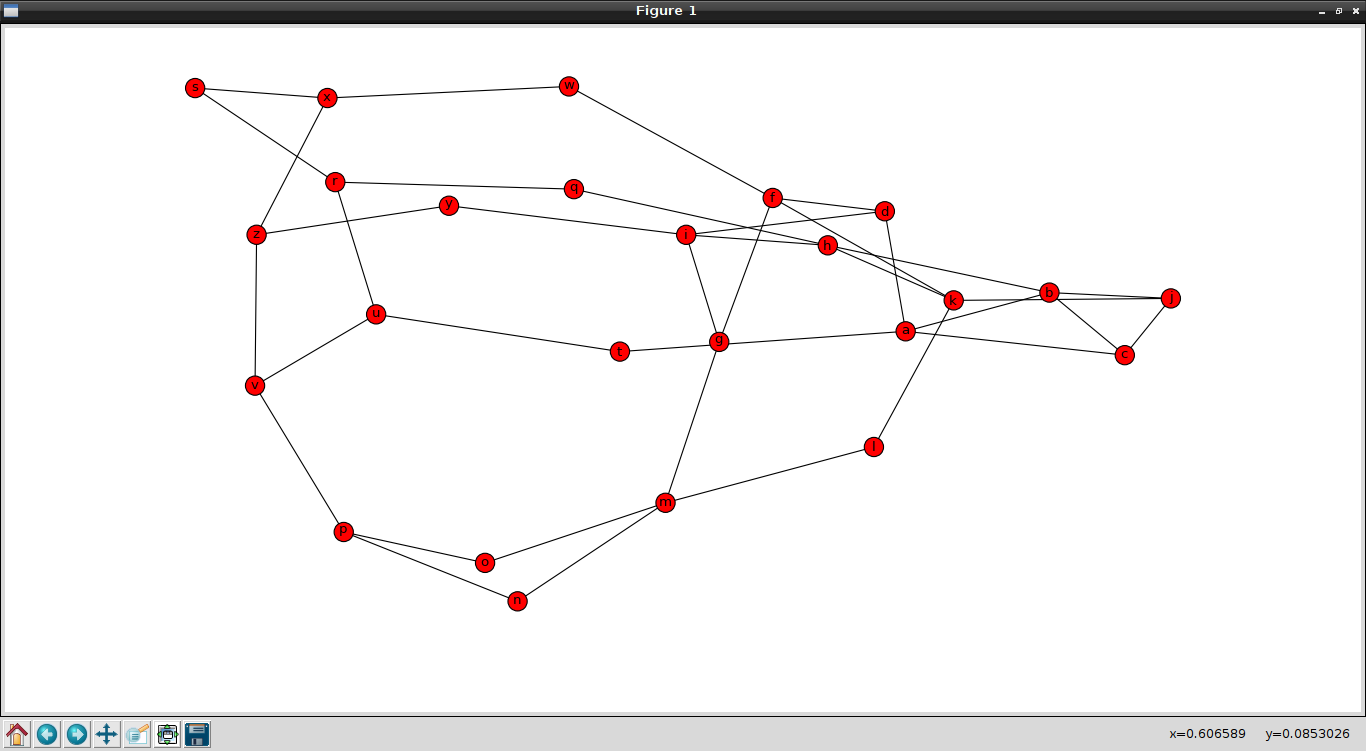
The normal graph is shown in the following figure:
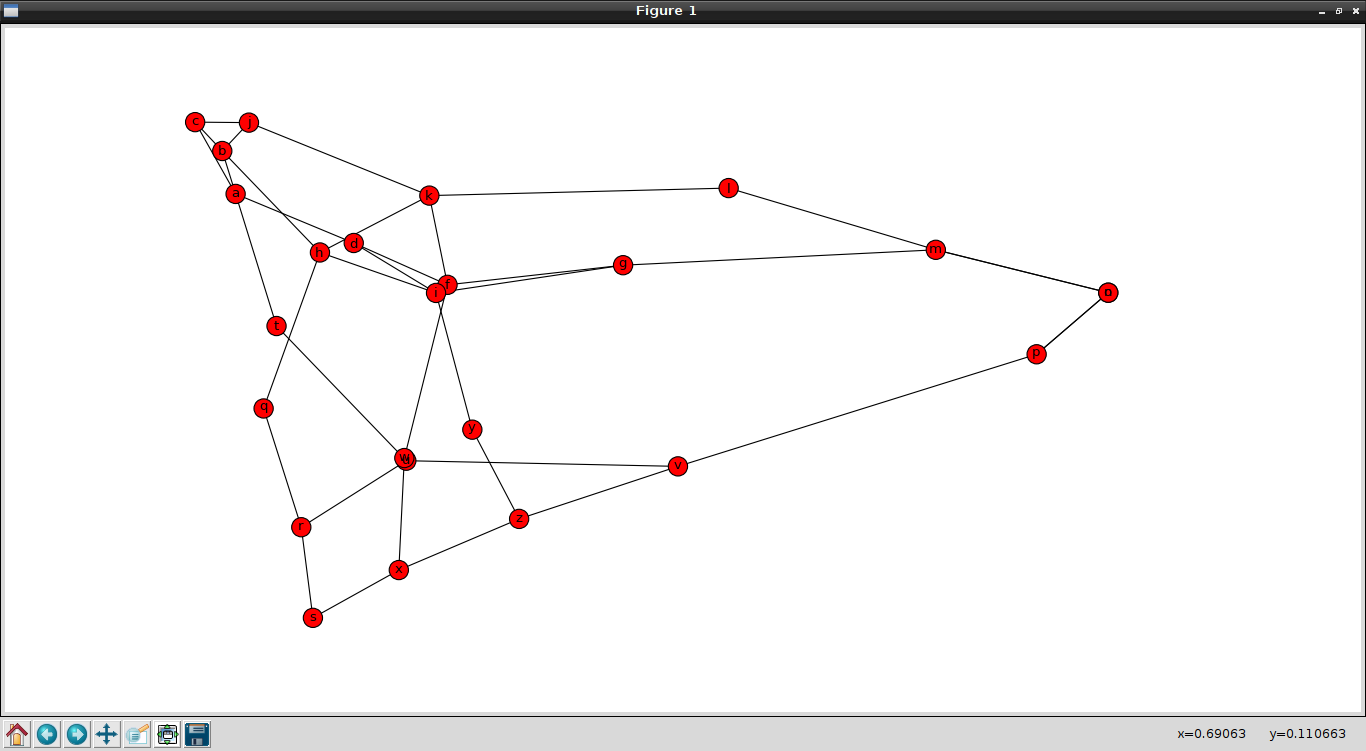
The spectral graph is shown below:
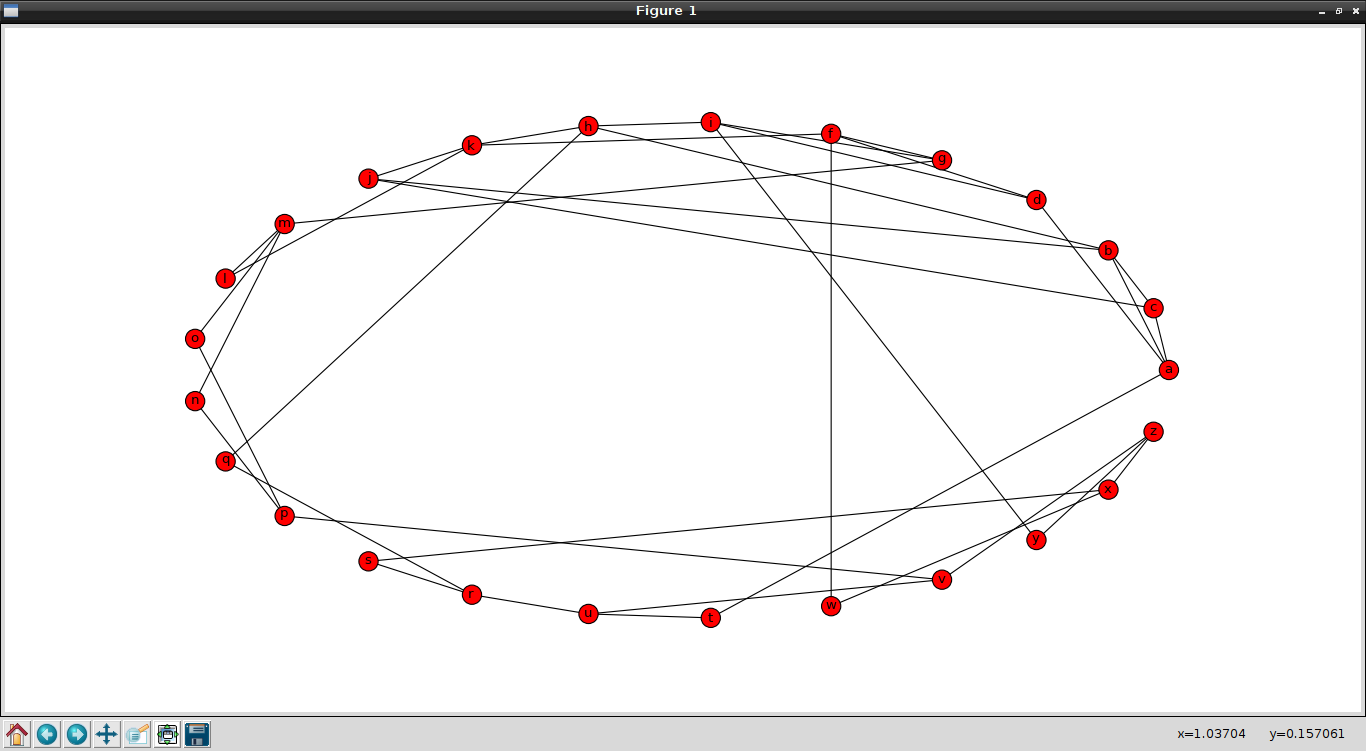
The circular graph is shown below:
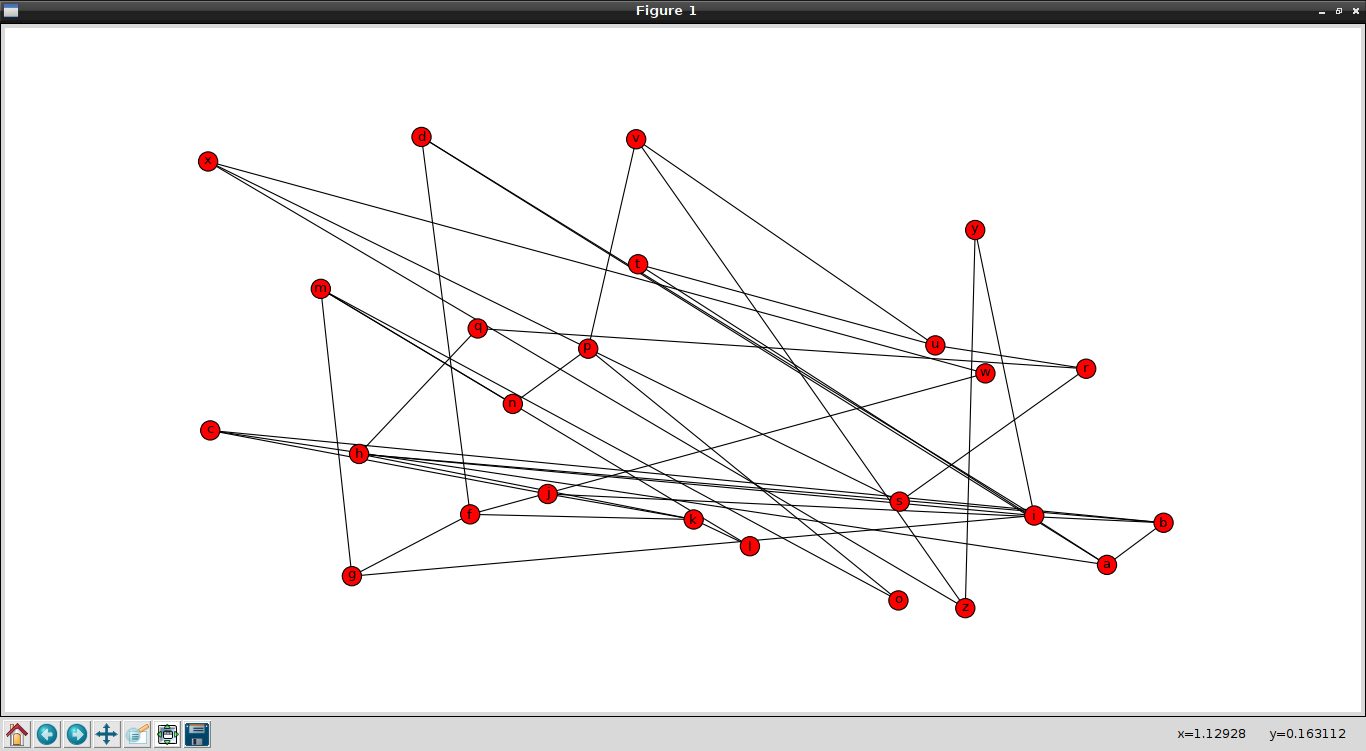
The random graph is shown below:
Besides the plots, the following is printed on screen:
Nodos:  ['a', 'c', 'b', 'd', 'g', 'f', 'i', 'h', 'k', 'j', 'm', 'l', 'o', 'n', 'q', 'p', 's', 'r', 'u', 't', 'w', 'v', 'y', 'x', 'z']

Relaciones:  [('a', 'c'), ('a', 'b'), ('a', 'd'), ('a', 't'), ('c', 'b'), ('c', 'j'), ('b', 'h'), ('b', 'j'), ('d', 'i'), ('d', 'f'), ('g', 'i'), ('g', 'm'), ('g', 'f'), ('f', 'w'), ('f', 'k'), ('i', 'y'), ('i', 'h'), ('h', 'q'), ('h', 'k'), ('k', 'j'), ('k', 'l'), ('m', 'o'), ('m', 'l'), ('m', 'n'), ('o', 'p'), ('n', 'p'), ('q', 'r'), ('p', 'v'), ('s', 'x'), ('s', 'r'), ('r', 'u'), ('u', 't'), ('u', 'v'), ('w', 'x'), ('v', 'z'), ('y', 'z'), ('x', 'z')]

Vecinos de m:  ['o', 'l', 'g', 'n']

Valor del nodo a:  {'c': {}, 'b': {'weight': 1}, 'd': {}, 't': {}}

Peso de la relacion entre a y b:  {'weight': 1}

Ruta mas corta entre m y b:  ['m', 'l', 'k', 'h', 'b']

Promedio de la ruta mas corta  2.99

Muestra la relacion de ruta mas corta entre pares de nodos relacionado con m:  {'a': ['m', 'g', 'i', 'd', 'a'], 'c': ['m', 'l', 'k', 'j', 'c'], 'b': ['m', 'g', 'i', 'h', 'b'], 'd': ['m', 'g', 'i', 'd'], 'g': ['m', 'g'], 'f': ['m', 'g', 'f'], 'i': ['m', 'g', 'i'], 'h': ['m', 'g', 'i', 'h'], 'k': ['m', 'l', 'k'], 'j': ['m', 'l', 'k', 'j'], 'm': ['m'], 'l': ['m', 'l'], 'o': ['m', 'o'], 'n': ['m', 'n'], 'q': ['m', 'g', 'i', 'h', 'q'], 'p': ['m', 'o', 'p'], 's': ['m', 'g', 'f', 'w', 'x', 's'], 'r': ['m', 'g', 'i', 'h', 'q', 'r'], 'u': ['m', 'o', 'p', 'v', 'u'], 't': ['m', 'g', 'i', 'd', 'a', 't'], 'w': ['m', 'g', 'f', 'w'], 'v': ['m', 'o', 'p', 'v'], 'y': ['m', 'g', 'i', 'y'], 'x': ['m', 'g', 'f', 'w', 'x'], 'z': ['m', 'o', 'p', 'v', 'z']}

Ruta mas corta usando el algoritmo de Dijkstra entre m y b: ['m', 'g', 'i', 'h', 'b']
This way you can extract information from the graph, such as the shortest path between m and b (m, g, i, h and b), which gives the same result using Dijkstra's Algorithm.
Make a donation! If you liked the article you can make a donation with Bitcoin (BTC) using the digital wallet of your choice to the following address: 17MtNybhdkA9GV3UNS6BTwPcuhjXoPrSzV
Or by scanning the QR code from your wallet:
