The first article about networkx showed how to create the nodes and links of networks (relationship between States and Cities of Venezuela).
This article is based on an article from the site "The Glowing PythonThe Glowing Python", called Getting started with Networkx (in English). That article uses as an example the relationships between the characters of the novel Les Misérables. It uses a file with the gml extension that holds the relationships between the characters; you can download the file from here (broken link).
The file contains the definition of the nodes within a graph; the information of each node is placed between brackets as shown below:
graph

[

  node

  [

    id 0

    label "Myriel"

  ]

  node

  [

    id 1

    label "Napoleon"

  ]

  node

  [

    id 2

    label "MlleBaptistine"

  ]

  node

  [

    id 3

    label "MmeMagloire"

  ]

...

]
The node is identified and a label is set; in this case the label is a character from the novel mentioned above.
The code that generates the graph is shown below:
#!/usr/bin/env python

#Se importa networkx como nx

import networkx as nx

#Se importa la libreria pyplot de matplotlib como plt

import matplotlib.pyplot as plt

# leer el grafo desde archivo con formato gml

G = nx.read_gml('losmiserables.gml',relabel=True)

# dibujar la red completa.

plt.figure(1)

nx.draw_spring(G,node_size=0,edge_color='b',alpha=.2,font_size=10)

plt.show()
The graph is shown below:
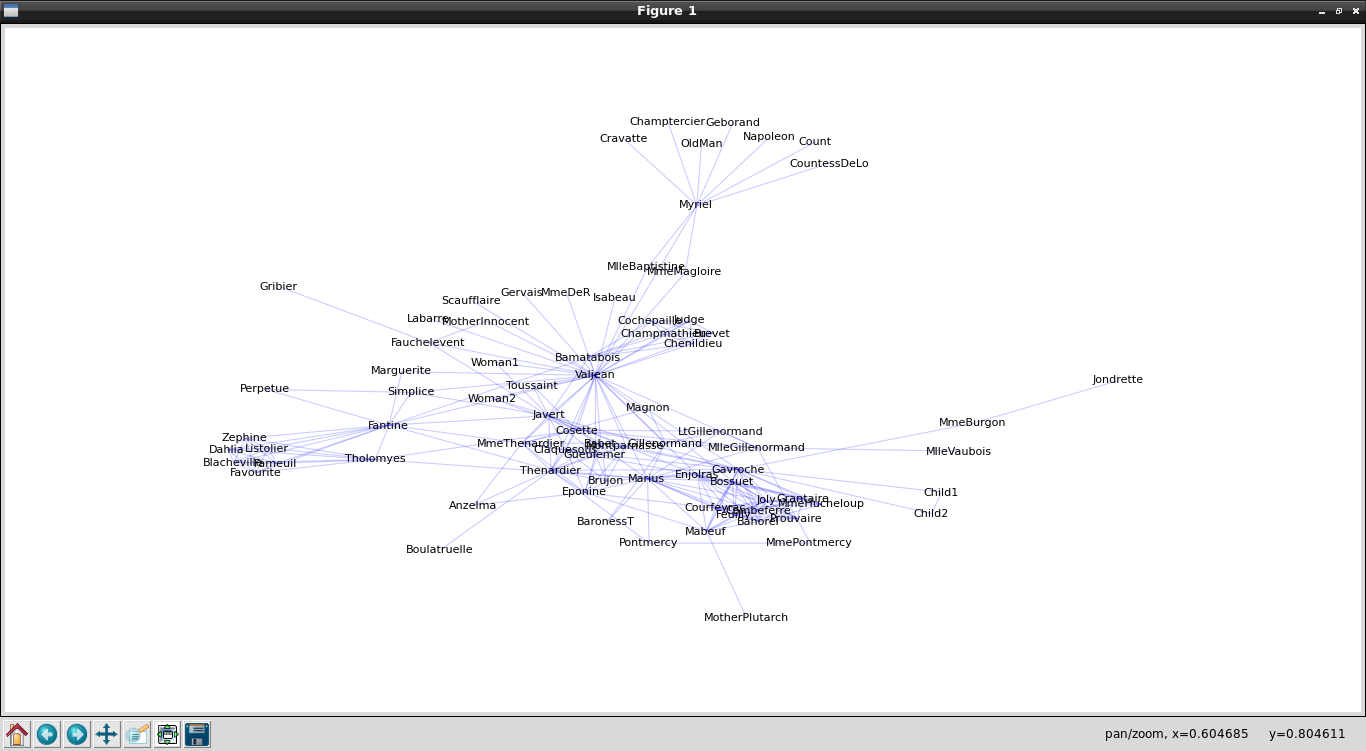
The graph by itself does not show much useful information; to understand the graph better, a histogram of the number of connections per node will be created (it continues the previous code):
#Histograma

#Se crea la figura 2

plt.figure(2)

#se crea la instancia degree del grafo

d = nx.degree(G)

#Se crea el histograma con los valore del grafo.

plt.hist(d.values(),bins=15)

#Se muestra la grafica.

plt.show()
The following figure shows the histogram:
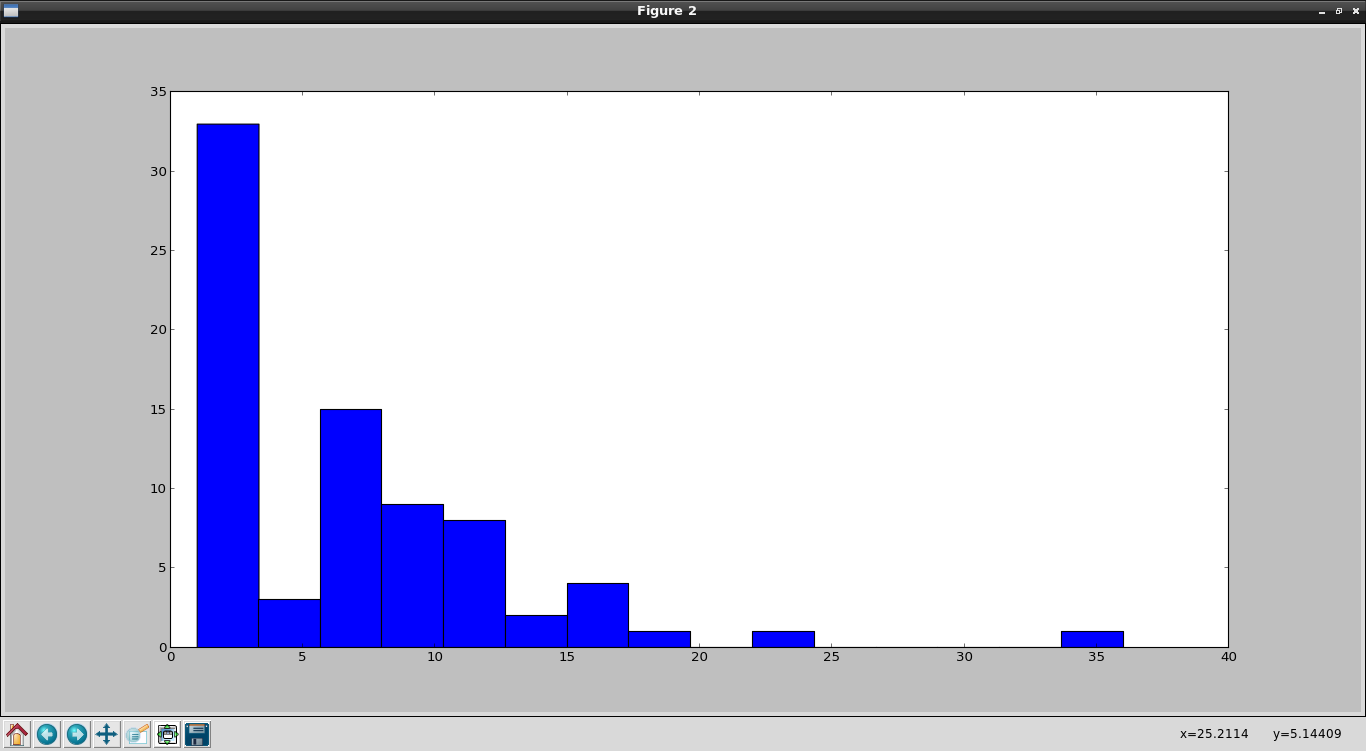
The histogram shows that only a few characters have more than 10 connections. Below is the code for a graph of only those characters with more than 10 connections:
def trim_nodes(G,d):

    """ retorna una copia de G sin

      los nodos de menos de d conexiones"""

    #Se crea la copia de G

    Gt = G.copy()

    #Se define la instancia de degree con la copia de G

    dn = nx.degree(Gt)

    #Se recorre los nodos y se remueve los que tengan menos de d conexiones

    for n in Gt.nodes():

        if dn[n] <= d:

            Gt.remove_node(n)

    #Se retorna el nuevo G

    return Gt

# dibujar la red solo con nodos de mas de 10

#conexiones

Gt = trim_nodes(G,10)

#Se crea la figura 3

plt.figure(3)

#Se dibuja el grafo

nx.draw(Gt,node_size=0,node_color='w',edge_color='b',alpha=.2)

#Se muestra en pantalla el grafo

plt.show()
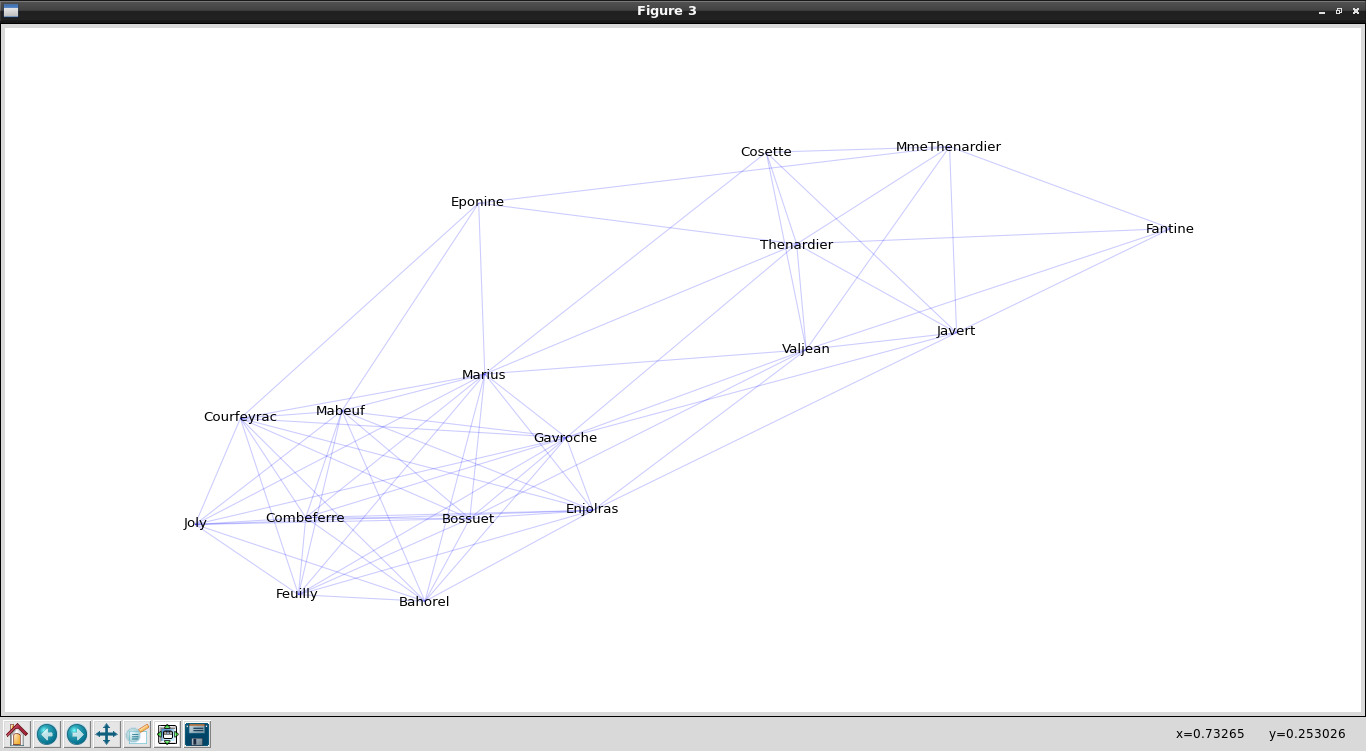
The graph with the most relevant characters of the novel Les Misérables is shown below:
Make a donation! If you liked the article you can make a donation with Bitcoin (BTC) using the digital wallet of your choice to the following address: 17MtNybhdkA9GV3UNS6BTwPcuhjXoPrSzV
Or by scanning the QR code from your wallet:
