Networkx (broken link) is a Python library that makes it easy to create, manipulate and study dynamic structures, and provides functions for complex networks.
At the following link (broken link) you will find a tutorial from the official networkx site, which explains how to create a graph, the nodes, and how to link those nodes.
The following example will create nodes about Venezuela, some States and Cities. The first thing to do is create the nodes, then the links between the nodes are defined.
The code is shown below:
#!/usr/bin/env python

# -*- coding: utf-8 -*-

#Se importa la libreria networkx como nx

import networkx as nx

#Se importa la libreria pyplot de matplotlib como plt

import matplotlib.pyplot as plt

#Se crea un grafo vacio

G=nx.Graph()

#Se crean los nodos:

#Nodo Venezuela

G.add_node("Venezuela")

#Se crean los nodos de los estados

G.add_nodes_from(["Carabobo","Miranda","Aragua","Merida","Lara","Distrito Capital"])

#Se crean los nodos de las ciudades.

G.add_nodes_from((["Valencia","Barquisimeto","Merida","Caracas","Guacara","Carora","Cubiro"]))

#Se crean los enlaces de los estados al país

G.add_edge("Carabobo","Venezuela")

G.add_edge("Lara","Venezuela")

G.add_edge("Merida","Venezuela")

G.add_edge("Distrito Capital","Venezuela")

G.add_edge("Aragua","Venezuela")

G.add_edge("Miranda","Venezuela")

#Se crean los nodos de las ciudades a su respectivo estado

v1 = ("Valencia","Carabobo")

v2 = ("Guacara","Carabobo")

dc = ("Caracas","Distrito Capital")

G.add_edge(*v1)

G.add_edge(*v2)

G.add_edge("Tocuyito","Carabobo")

G.add_edge("San Diego","Carabobo")

G.add_edge("Puerto Cabello","Carabobo")

G.add_edge("Moron","Carabobo")

G.add_edge("Rafael Urdaneta","Valencia")

G.add_edge(u"Miguel Peña","Valencia")

G.add_edge("Santa Rosa","Valencia")

G.add_edge("Candelaria","Valencia")

G.add_edge(*dc)

G.add_edge("Barquisimeto","Lara")

G.add_edge("Carora","Lara")

G.add_edge("Cubiro","Lara")

G.add_edge("Merida","Merida")

G.add_edge("El Vigia","Merida")

G.add_edge("Ejido","Merida")

#Se dibuja el grafo

nx.draw(G)

#Se muestra en pantalla

plt.show()

#Se vuelve a dibujar el grafo y se salva en un archivo png.

nx.draw(G)

plt.savefig("networkx1.png")

#Se muestra información de los nodos (cantidad, nodos)

print "Nodos: ", G.number_of_nodes(), G.nodes()

#SE muestra información de los enlaces (cantidad, enlaces)

print "Enlaces: ", G.number_of_edges(),G.edges()
The image showing the graph produced by the program is the following:
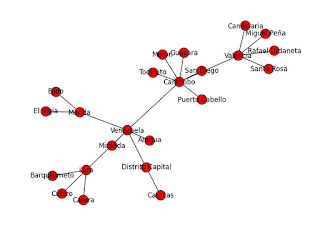
The output of printing the number of nodes, the nodes, the number of links and the links is the following:
Nodos:  23 ['Caracas', 'Ejido', u'Miguel Pe\xf1a', 'Tocuyito', 'Aragua', 'Santa Rosa', 'Valencia', 'Moron', 'Carora', 'Venezuela', 'San Diego', 'Cubiro', 'Miranda', 'Puerto Cabello', 'El Vigia', 'Distrito Capital', 'Barquisimeto', 'Merida', 'Rafael Urdaneta', 'Lara', 'Guacara', 'Carabobo', 'Candelaria']
Enlaces:  23 [('Caracas', 'Distrito Capital'), ('Ejido', 'Merida'), (u'Miguel Pe\xf1a', 'Valencia'), ('Tocuyito', 'Carabobo'), ('Aragua', 'Venezuela'), ('Santa Rosa', 'Valencia'), ('Valencia', 'Candelaria'), ('Valencia', 'Carabobo'), ('Valencia', 'Rafael Urdaneta'), ('Moron', 'Carabobo'), ('Carora', 'Lara'), ('Venezuela', 'Distrito Capital'), ('Venezuela', 'Lara'), ('Venezuela', 'Merida'), ('Venezuela', 'Miranda'), ('Venezuela', 'Carabobo'), ('San Diego', 'Carabobo'), ('Cubiro', 'Lara'), ('Puerto Cabello', 'Carabobo'), ('El Vigia', 'Merida'), ('Barquisimeto', 'Lara'), ('Merida', 'Merida'), ('Guacara', 'Carabobo')]
You can download the code from the bitbucket (broken link) repository.
Make a donation! If you liked the article you can make a donation with Bitcoin (BTC) using the digital wallet of your choice at the following address: 17MtNybhdkA9GV3UNS6BTwPcuhjXoPrSzV
Or by scanning the QR code from your wallet:
