In this article the Quandl library will be used directly as the data source. The idea is to obtain the market prices of 3 airlines (Delta with code DAL, Jet Blue with code JBLU and Southwest with code LUV). The historical closing prices, the sales volume and the moving averages of these three airlines are plotted.
Continuing with the articles on Pandas and Data ScienceData Science, the previous article showed how to work with time series by obtaining data from Quandl.
This article is based on an English article titled Visualizing Time Series Data of Stock Prices (that article uses the pandas_datareader library, but it is giving errors, so the Quandl library will be used).
The exercise code is shown below:
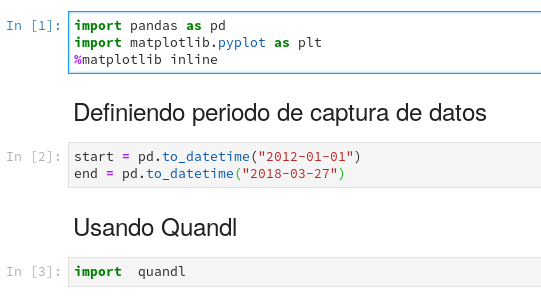
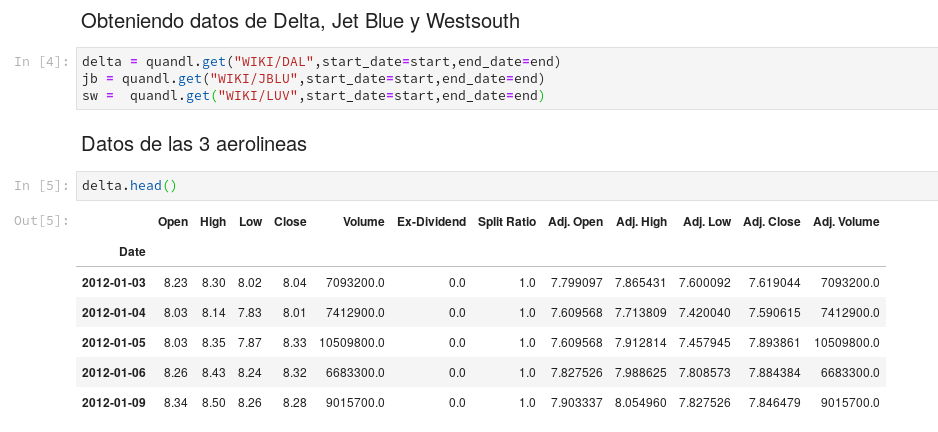
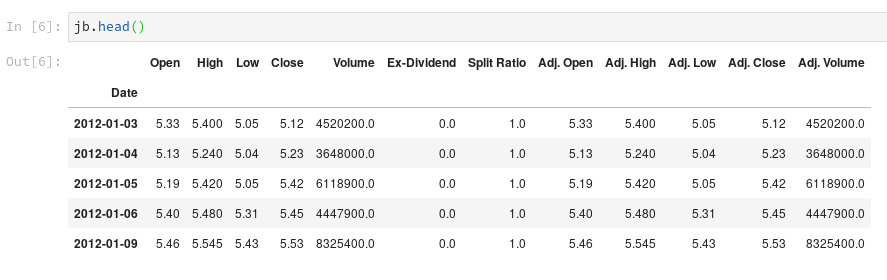
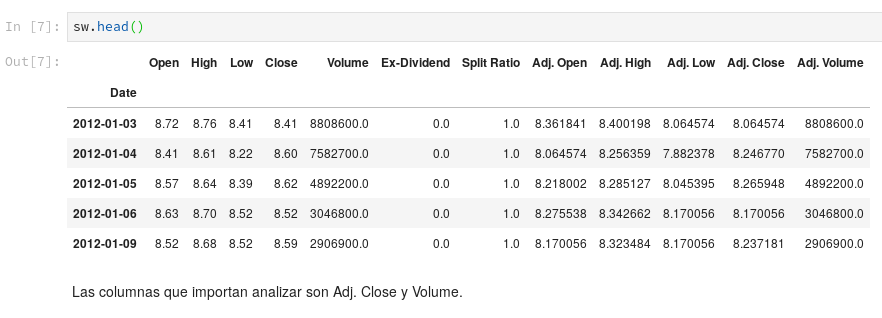
Visualizing
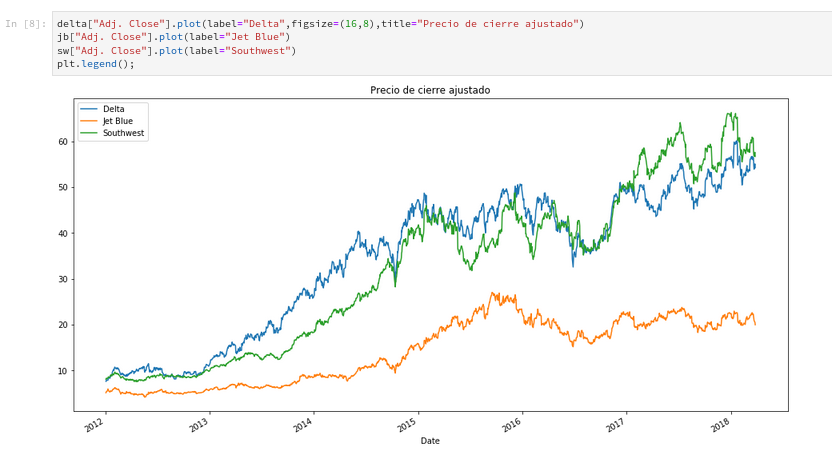
Plotting the adjusted closing price
The adjusted closing price of the 3 airlines will be plotted.
Plotting the Volume
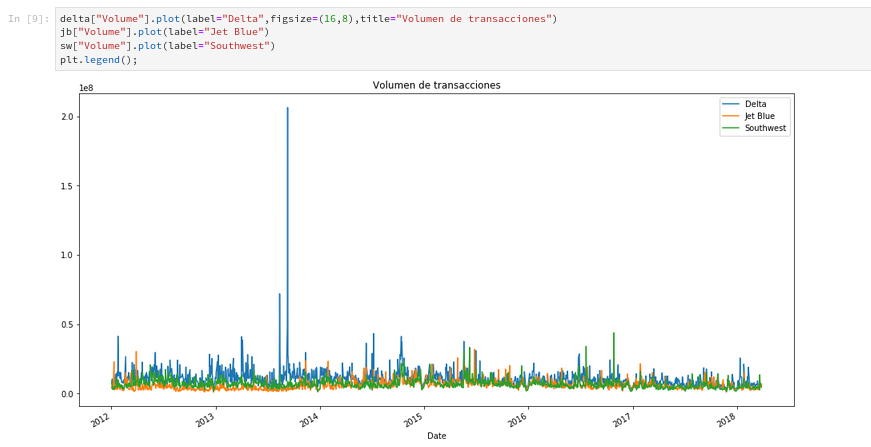
You can notice that the airline Delta has a very high spike at some point in 2013. To get the date, the idxmax method is used.

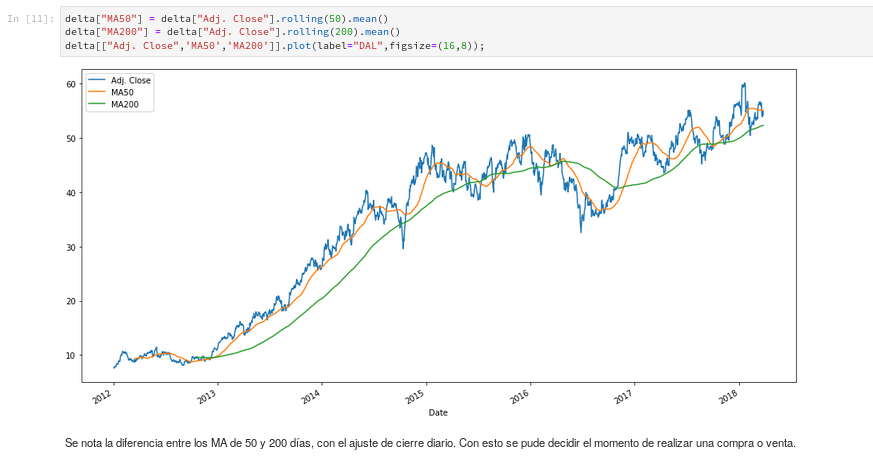
Moving averages MA
Moving averages are used to detect trading opportunities. This calculation takes the mean or average of past prices (it is called a moving average because the data is continuously moving). Depending on the type of investor (high risk vs low risk, short term vs long term), the moving averages can be set to 10 days, 20 days, 50 days, 200 days, 1 year, 5 years, etc. In this case the 50-day and 200-day moving averages will be calculated.
You can download the raw notebook from the gitlab repository.
If you have any suggestion or idea about how this article can be applied, you can leave it in the comments.
Make a donation! If you liked the article you can make a donation with Bitcoin (BTC) using the digital wallet of your choice to the following address: 17MtNybhdkA9GV3UNS6BTwPcuhjXoPrSzV
Or by scanning the QR code from your wallet:
