The idea of this article is to explain in a basic way how to use Pandas to get financial data, in this case the value of the currencies of countries such as Argentina, Brazil, Chile, Mexico and Venezuela. Quandl is a financial and economic alternative data platform that serves professional investors. The Quandl API gives access to its data through the R language, Python, Matlab, Maple and Stata. More information on wikipedia (broken link) and on its site.
In this case the data will be accessed through Python and visualized with Pandas and matplotlib.
The Quandl information for the countries:
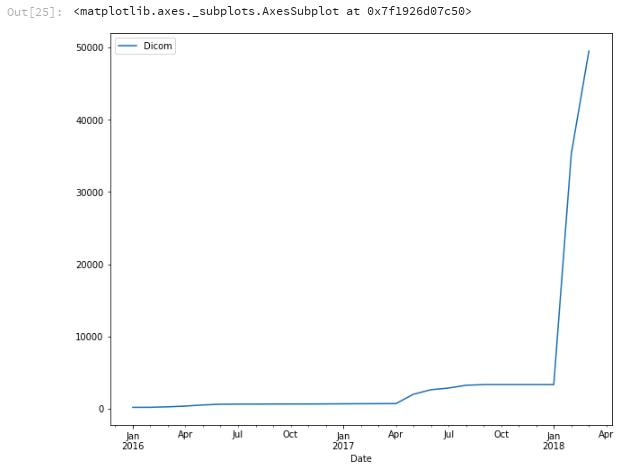
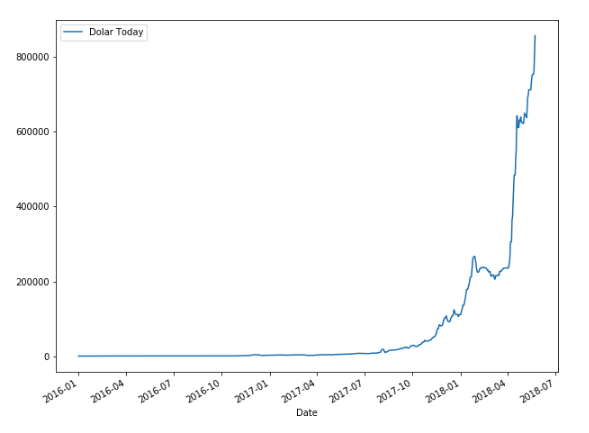
- Venezuela : Dicom (broken link) and Dolar Today (broken link)
- Argentina (broken link)
- Brazil (broken link)
- Chile (broken link)
- Mexico (broken link)
The process would be the following:
- Import libraries
- Access the countries' data in Quandl
- Sort the columns, remove NaN.
- Create a portfolio
- Visualize the data
You can see the codes to access the data, for example for Mexico, in the following image.
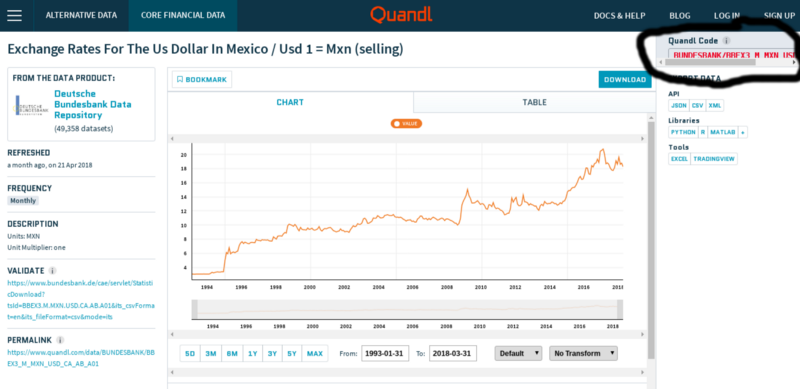
Quandl page with the Dollar information for Mexico
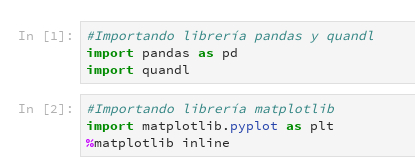
- Import the pandas, quandl and matplotlib libraries
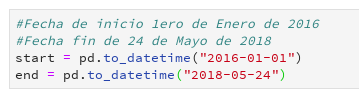
- Define the start and end dates of the analysis
- Get data from quandl

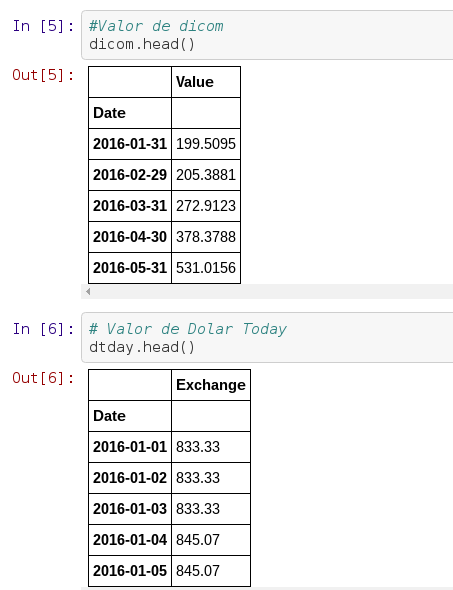
- Visualize the Dicom and Dolar today data
- Create the portfolio that groups all the quotes
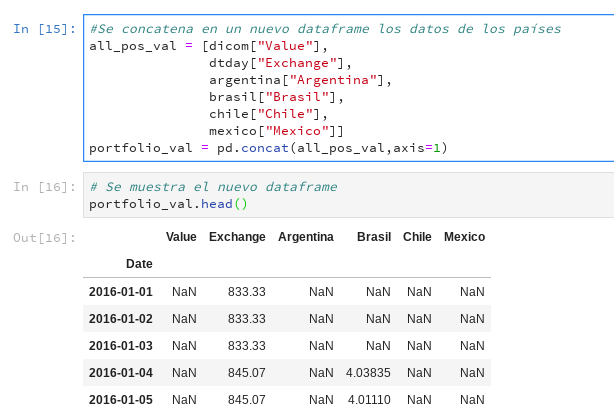
- Drop the NaN fields and rename the columns
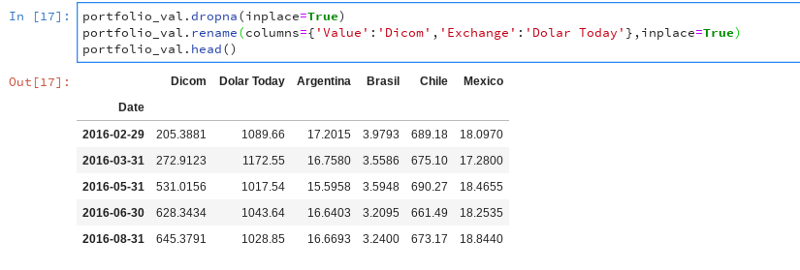
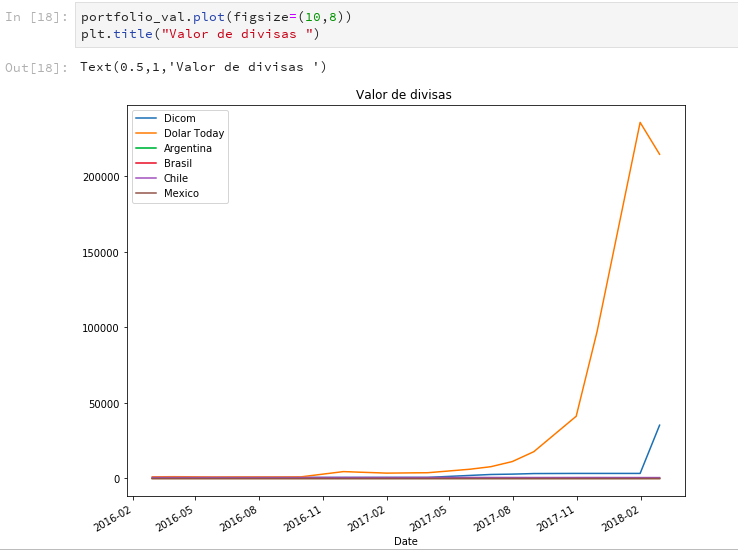
- Plot all the quotes
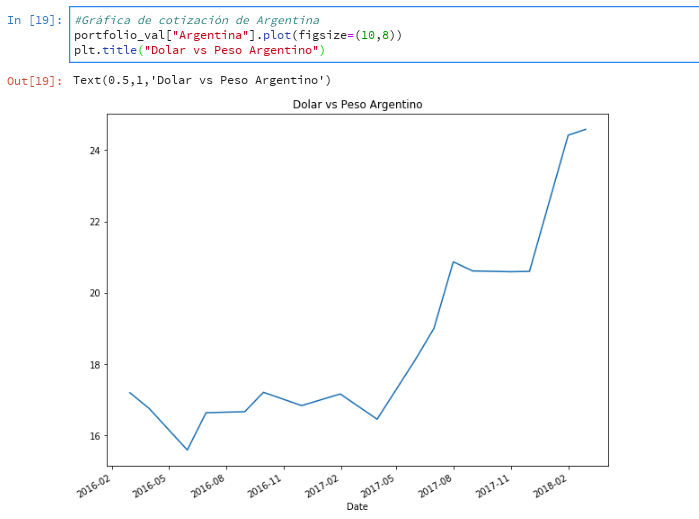
- Plot for Argentina
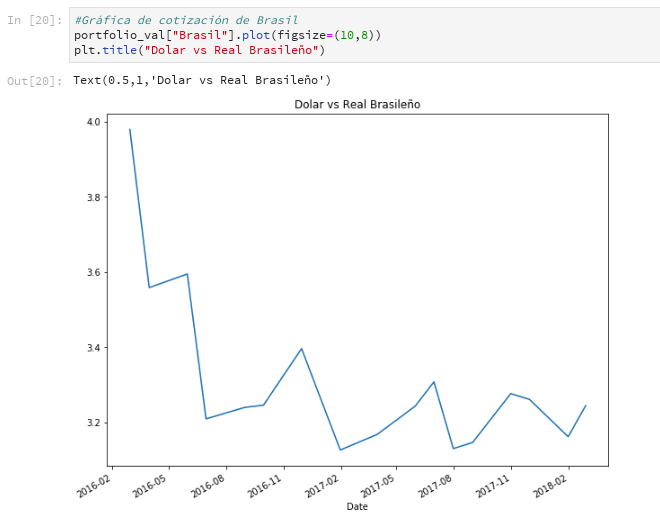
- Plot for Brazil
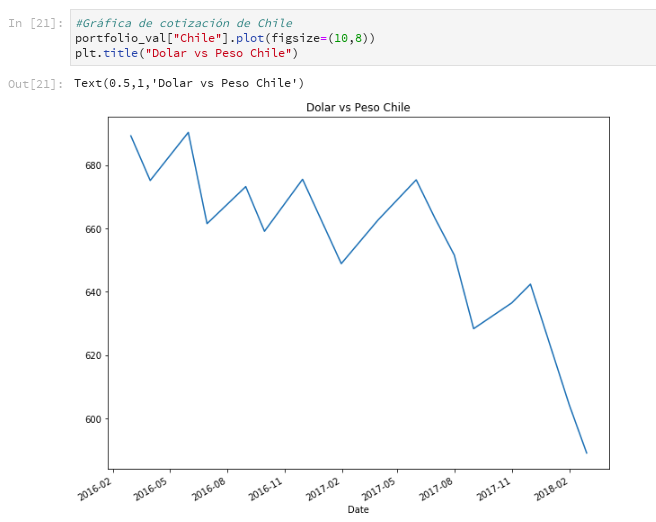
- Plot for Chile
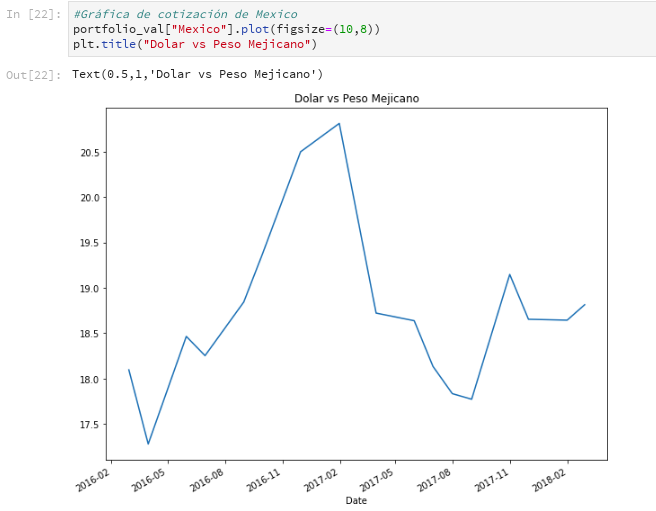
- Plot for Mexico
- Plot for Venezuela
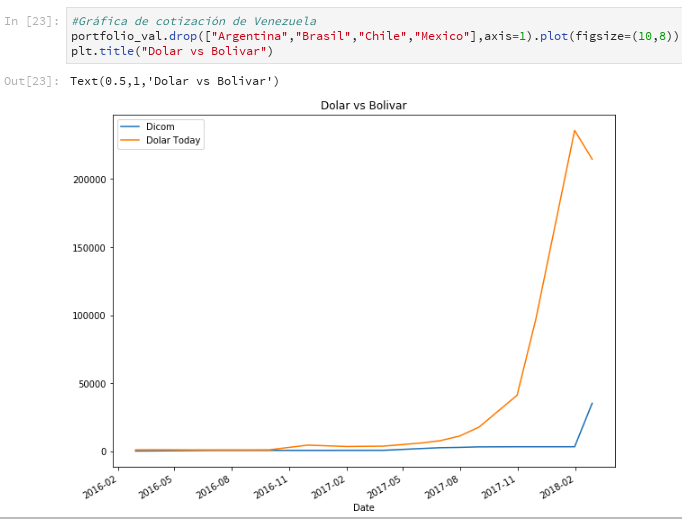
- Dicom and Dolar Today plots separately

You can see the complete notebook at:
ecrespo/articulos-cienciadedatos
Contribute to articulos-cienciadedatos development by creating an account on GitHub.github.com
Make a donation! If you liked the article you can make a donation with Bitcoin (BTC) using the digital wallet of your choice to the following address: 17MtNybhdkA9GV3UNS6BTwPcuhjXoPrSzV
Or by scanning the QR code from your wallet:
