Continuing with the articles about TensorFlow, in this case I will show how the Graph object is visualized with TensorBoard.
You can check the articles of the TensorFlow series below:
- Hello world from Tensorflow
- Basic math with Tensorflow
- Handling matrices with Tensorflow
- Variables and placeholders in Tensorflow
- Tensorflow Graph object
This article is based on the English tutorial Visualization (broken link) and the documentation on the TensorFlow.
There will be two ways of doing the same exercise: the first one simply identifies the operations in the Graph Object (addition, multiplication and division), then the session log is saved and visualized.
In the next exercise the same operations will be done, but now the Graph Objects are identified with scopes, which will allow a better visualization of those objects and their operations.
Here is the first exercise:
In [1]:
#Se importa Tensorflow
import tensorflow as tf
In [2]:
#Se suma 1+2
a = tf.add(1, 2,name="Suma_estos_numeros")
In [3]:
#Se multiplica el valor de la suma anterior por 3
b = tf.multiply(a, 3)
In [4]:
#se suma 4+5
c = tf.add(4, 5,name="Suma_estos")
In [5]:
#Se multiplica el resultado de la suma anterior por 6
d = tf.multiply(c, 6,name="Multiplica_estos_numeros")
In [6]:
#Se multiplica 4*5
e = tf.multiply(4, 5,name="B_suma")
In [7]:
#Se divide el resultado de la suma de 4+5 entre 6
f = tf.div(c, 6,name="B_mul")
In [8]:
#Se suma la multiplicación de a*3 más la multiplicación de c*6
g = tf.add(b, d)
In [9]:
#Se multiplica el resultado de la suma de b+d con el resultado de la división de c/6
h = tf.multiply(g, f)
In [10]:
#Se crea la sesión y se corre el resultado del objeto h y se salva en el directorio output.
with tf.Session() as sess:
    writer = tf.summary.FileWriter("output", sess.graph)
    print(sess.run(h))
    writer.close()
63
In [ ]:
undefinedNow tensorboard will be run, passing it the output directory where the session log with its operations was saved.
tensorboard --logdir=./output/The command will start a web session of the tensorboard application, as the following figure shows:

Opening the browser at localhost:6006 shows what the following figure displays:
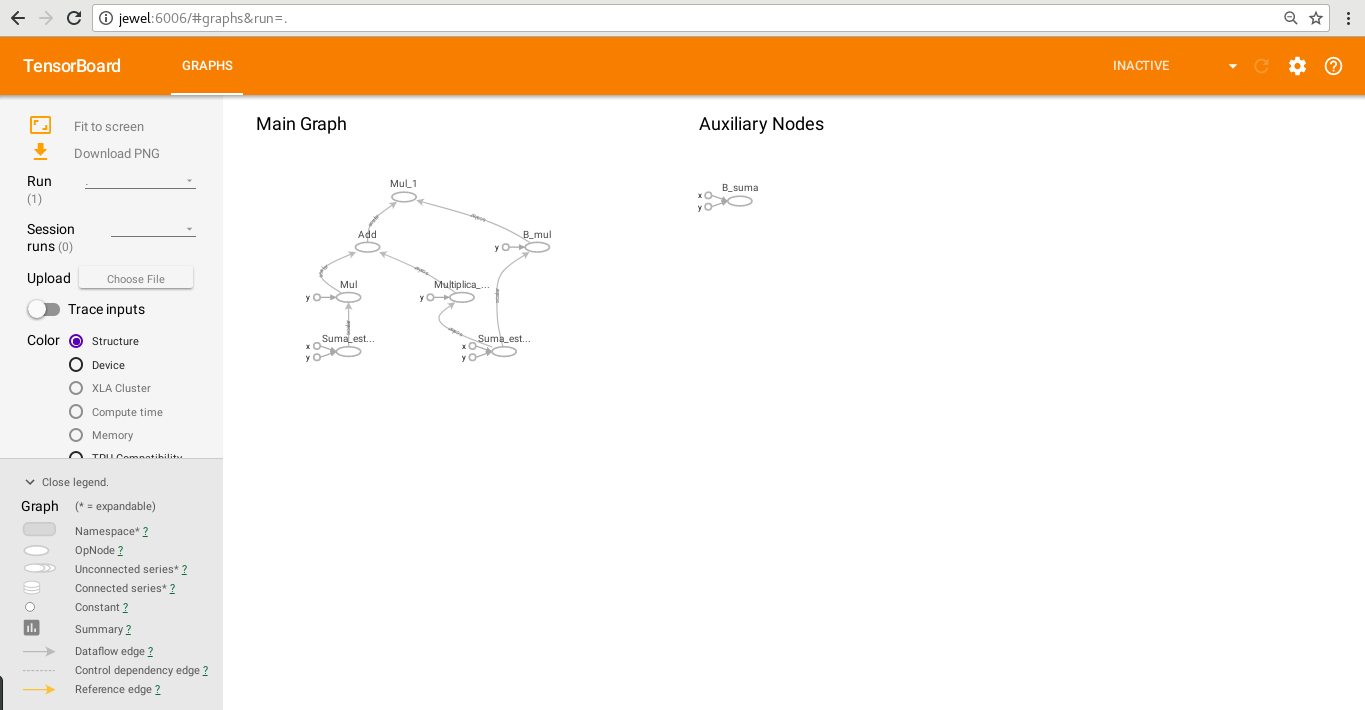
There you can see the operations performed in the session and in the Graph object.
But the Graph objects and the operations can be grouped to make it easier to visualize the Objects and their operations.
Here is the rewrite of the same exercise:
In [1]:
import tensorflow as tfIn [2]:
#Se define el nombre del objeto graph y los scopes A,B y C.
with tf.name_scope("GrupoOperacion"):
    with tf.name_scope("Scope_A"):
        a = tf.add(1, 2, name="Suma_estos_numeros")
        b = tf.multiply(a, 3)
    with tf.name_scope("Scope_B"):
        c = tf.add(4, 5, name="Y_estos")
        d = tf.multiply(c, 6, name="Multiplica_estos_numeros")

with tf.name_scope("Scope_C"):
    e = tf.multiply(4, 5, name="B_suma")
    f = tf.div(c, 6, name="B_mult")
g = tf.add(b, d)
h = tf.multiply(g, f)
In [3]:
#Se crea la sesión y se corre el resultado del objeto h
with tf.Session() as sess:
    writer = tf.summary.FileWriter("output2", sess.graph)
    print(sess.run(h))
    writer.close()
63
Tensorboard is run again, but in this case opening the output2 directory:
tensorboard --logdir=./output2/The following image shows the different Graphs and each operation each one handles.
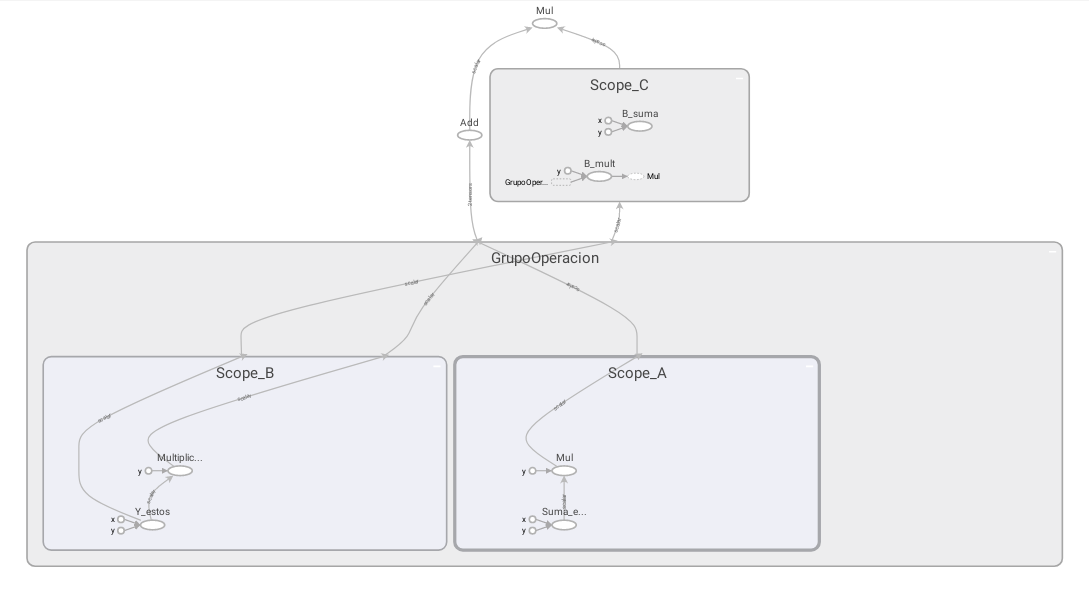
This gives a better visualization of each Graph Object and its operations.
Make a donation! If you liked the article you can make a donation with Bitcoin (BTC) using the digital wallet of your choice to the following address: 17MtNybhdkA9GV3UNS6BTwPcuhjXoPrSzV
Or by scanning the QR code from your wallet:
