From this article on, matplotlib plots will be explained with the PyQT graphical library. To that end, the pyQT series will be restarted in other articles.
This article takes the functions created in the previous article to calculate the trajectory of a projectile launch and creates an object based on the PyQT libraries.
#!/usr/bin/env python

#Para los argumentos desde la linea de comandos
import sys
# Importar GUI de PyQT
from PyQt4 import QtGui

# Importar numpy para la creacion de la imagen
import numpy as np

# Se importa el objeto Figure de Matplotlib
from matplotlib.figure import Figure

#Se importa QT4Agg como Canvas.
from matplotlib.backends.backend_qt4agg \
  import FigureCanvasQTAgg as FigureCanvas

#Se define la funcion x(t) de la ecuacion de posicion (movimiento horizontal)
def fx (t):
    #Se define la posicion inicial en 0
    x0 = 0
    #Se define la velocidad inicial en 2 mts/seg
    v0x = 2
    #Se define la aceleracion en 1 mts/seg^2
    ax = 1
    #Se hace el calculo de la posicion con respecto al tiempo
    x = x0 + v0x*t + 0.5*ax*t**2
    return x

#Se define la funcion y(t) de la ecuacion de posicion altura
def fy(t):
    #Se define la altura inicial en 100 mts
    y0 = 100
    #Se define la velocidad inicial en 10 mts/seg
    v0y = 10
    #Se define la gravedad en 9.81 mts/seg^2
    g = 9.81
    #Se realiza el calculo de l posicion en funcion del tiempo
    y = y0 + v0y*t - 0.5*g*t**2
    return y


class Lienzo(FigureCanvas):
    """Clase que represente a FigureCanvas"""
    def __init__(self):
        # Codigo para generar la grafica
        self.figura = Figure()
        self.ejes = self.figura.add_subplot(111)
        self.tiempo = np.arange(0.0, 5.65, 0.01)
        #Calculo de la posicion en el eje X y Y
        self.x = fx(self.tiempo)
        self.y = fy(self.tiempo)
        #Se crea la grafica
        self.ejes.plot(self.x, self.y)
        # inicializar el lienzo donde se crea la grafica.
        FigureCanvas.__init__(self, self.figura)


if __name__ == '__main__':
    # Se crea el GUI de la aplicacion
    qApp = QtGui.QApplication(sys.argv)

    # Se crea el widget para matplotlib
    mpl = Lienzo()
    # Se muestra el widget.
    mpl.show()
    #Se inicia el lazo de ejecucion de QT.
    sys.exit(qApp.exec_())
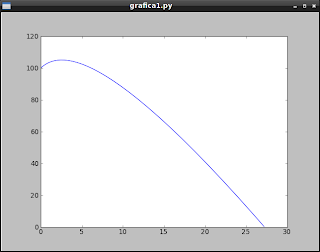
The following figure shows the plot of the projectile launch trajectory.
===
Make a donation! If you liked the article you can make a donation with Bitcoin (BTC) using the digital wallet of your choice to the following address: 17MtNybhdkA9GV3UNS6BTwPcuhjXoPrSzV
Or by scanning the QR code from your wallet:
