In February 2013 I wrote an article on How to make bubble charts with matplotlib; the idea was to see how a chart in the style of Hans Rosling's presentation is generated (he died in February 2017, by the way).
Below is the video that explains the history of 200 countries over 200 years, life expectancy and quality of life.
https://youtu.be/P2QHAbl45jc (broken link)
Or his TED talk on the best stats you've ever seen:
https://youtu.be/hVimVzgtD6w (broken link)
The article I mention used the dataset of crime rate by US state for the year 2005. But it only showed the information and not the variation over time.
This article is based on the following tutorial Python Gapminer Animation.
The script code is shown below as a jupyter notebook:
https://python-graph-gallery.com/341-python-gapminder-animation/
In [1]:
#Se importa las librerias matplitlib, numpy, pandas, seaborn
import matplotlib.pyplot as plt
import numpy as np
import seaborn as sns
sns.set_style("white")
import pandas as pd
my_dpi=96
In [2]:
# Se obtiene los datos en formato csv  y se convierte en un dataframe
url = 'https://python-graph-gallery.com/wp-content/uploads/gapminderData.csv'
data = pd.read_csv(url)
In [3]:
#Se muestra el data frame
data.head()
Out[3]:
| country | year | pop | continent | lifeExp | gdpPercap | |
|---|---|---|---|---|---|---|
| 0 | Afghanistan | 1952 | 8425333.0 | Asia | 28.801 | 779.445314 |
| 1 | Afghanistan | 1957 | 9240934.0 | Asia | 30.332 | 820.853030 |
| 2 | Afghanistan | 1962 | 10267083.0 | Asia | 31.997 | 853.100710 |
| 3 | Afghanistan | 1967 | 11537966.0 | Asia | 34.020 | 836.197138 |
| 4 | Afghanistan | 1972 | 13079460.0 | Asia | 36.088 | 739.981106 |
It has the columns country, year, population, continent, life expectancy and GDP per capita In [4]:
#Se revisa los tipos de datos de las columnas
data.info()
<class 'pandas.core.frame.DataFrame'>
RangeIndex: 1704 entries, 0 to 1703
Data columns (total 6 columns):
country      1704 non-null object
year         1704 non-null int64
pop          1704 non-null float64
continent    1704 non-null object
lifeExp      1704 non-null float64
gdpPercap    1704 non-null float64
dtypes: float64(3), int64(1), object(2)
memory usage: 80.0+ KB
Note that the continent column is of type object. It needs to be converted to a category type. In [5]:
# Transformar los datos de la columna continente a categoria.
data['continent']=pd.Categorical(data['continent'])
data.head()
Out[5]:
| country | year | pop | continent | lifeExp | gdpPercap | |
|---|---|---|---|---|---|---|
| 0 | Afghanistan | 1952 | 8425333.0 | Asia | 28.801 | 779.445314 |
| 1 | Afghanistan | 1957 | 9240934.0 | Asia | 30.332 | 820.853030 |
| 2 | Afghanistan | 1962 | 10267083.0 | Asia | 31.997 | 853.100710 |
| 3 | Afghanistan | 1967 | 11537966.0 | Asia | 34.020 | 836.197138 |
| 4 | Afghanistan | 1972 | 13079460.0 | Asia | 36.088 | 739.981106 |
In [6]:
#Se vuelve a revisar los tipos de las columnas y ahora se tiene que contienen es categoria
data.info()
<class 'pandas.core.frame.DataFrame'>
RangeIndex: 1704 entries, 0 to 1703
Data columns (total 6 columns):
country      1704 non-null object
year         1704 non-null int64
pop          1704 non-null float64
continent    1704 non-null category
lifeExp      1704 non-null float64
gdpPercap    1704 non-null float64
dtypes: category(1), float64(3), int64(1), object(1)
memory usage: 68.5+ KB
Now the life expectancy and GDP charts will be generated for each year; each chart is saved with its name and year so that later Image Magick can turn them into an animated gif In [7]:
# Por cada año
for i in data.year.unique():
    # inicializa la figura
    fig = plt.figure(figsize=(680/my_dpi, 480/my_dpi), dpi=my_dpi)
    # se cambia de color con c y alpha, se mapea el color del eje X.
    tmp=data[ data.year == i ]
    plt.scatter(tmp['lifeExp'], tmp['gdpPercap'] , s=tmp['pop']/200000 , c=tmp['continent'].cat.codes, cmap="Accent", alpha=0.6, edgecolors="white", linewidth=2)
    # Se agrega el título, y los ejes.
    plt.yscale('log')
    plt.xlabel("Experanza de vida")
    plt.ylabel("PIB per capita")
    plt.title("Año: "+str(i) )
    plt.ylim(0,100000)
    plt.xlim(30, 90)

    # Se salva el archivo como png, cada archivo por año.
    filename='Gapminder_step'+str(i)+'.png'
    plt.savefig(filename, dpi=96)
    plt.gca()
One of the generated images is shown:
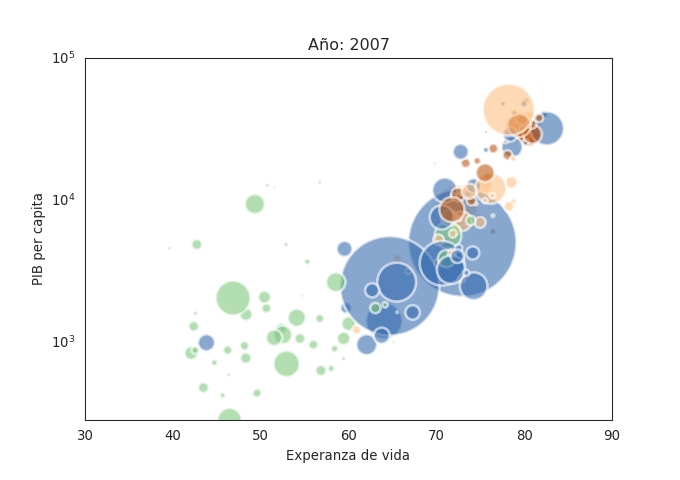
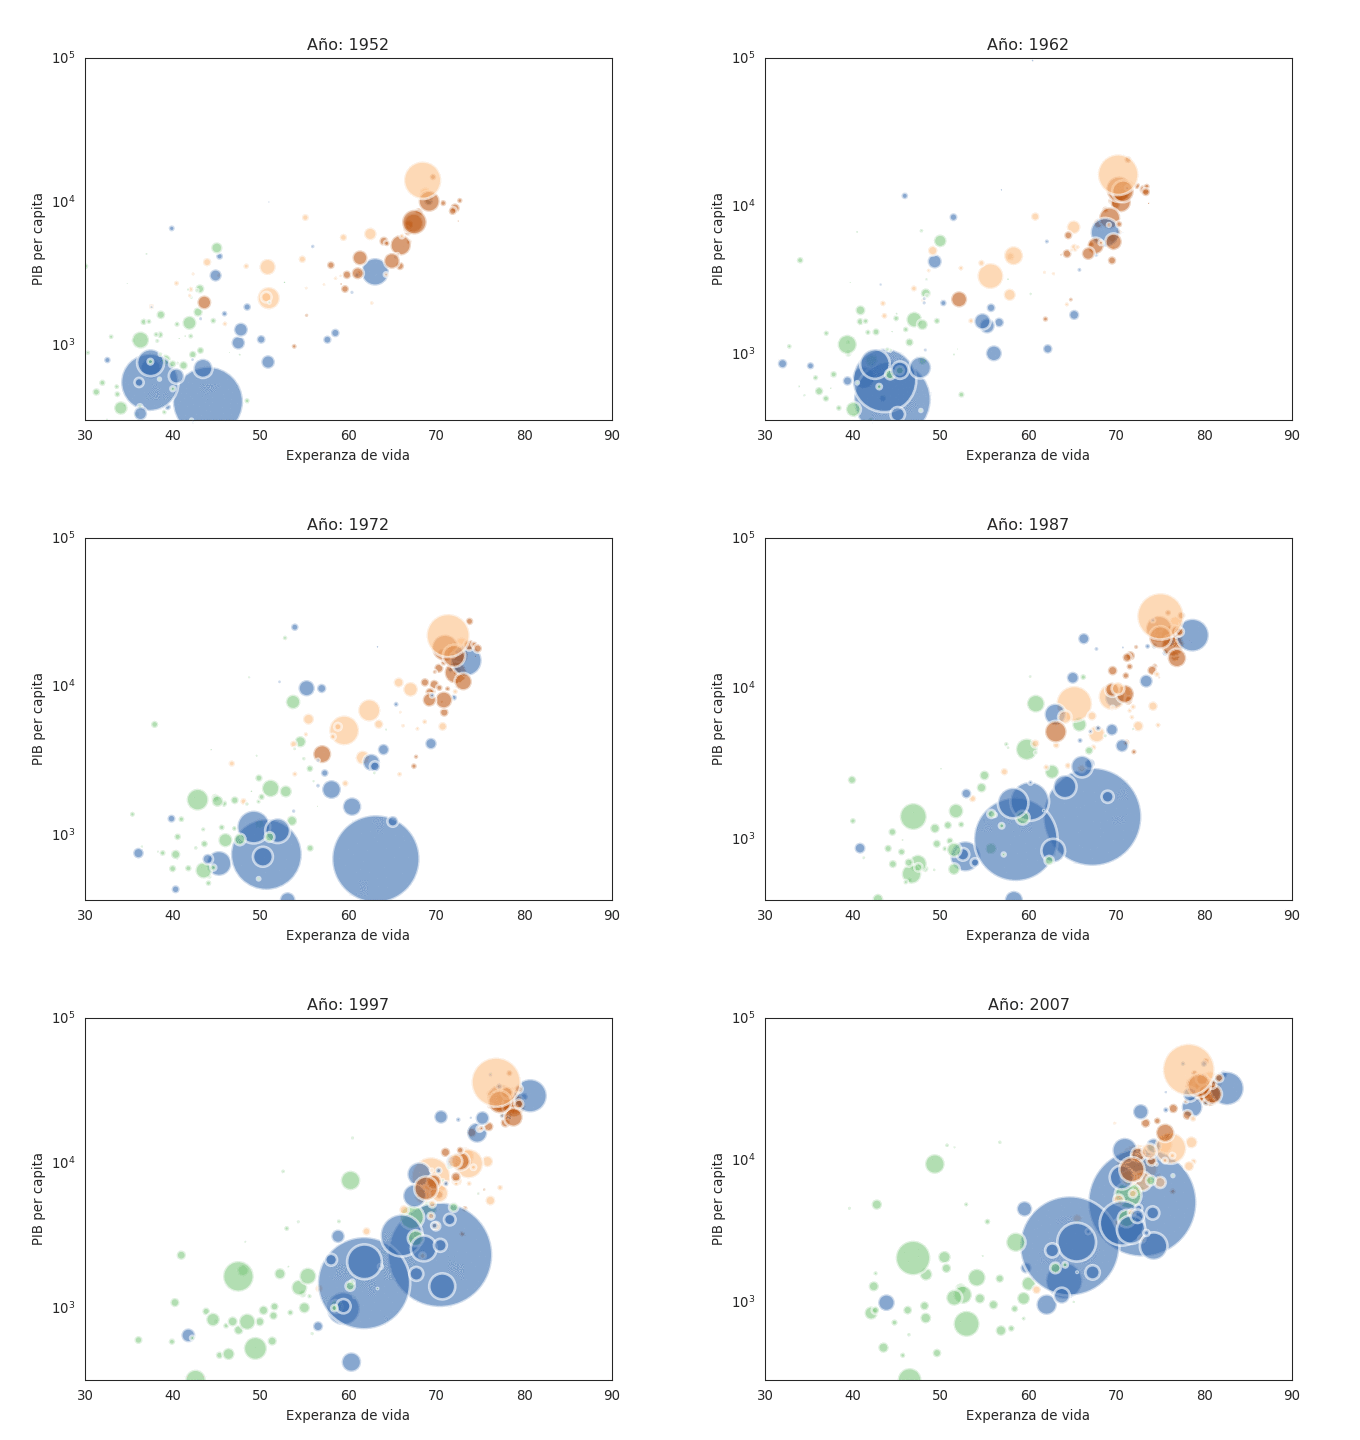
To convert the generated images into a gif, run the following image magick command:
convert -delay 80 Gapminder*.png animated_gapminder.gifThe resulting gif is shown below:
In the next article I hope to find the dataset of the article mentioned at the beginning so I can animate it as was done in this article.
Make a donation! If you liked the article you can make a donation with Bitcoin (BTC) using the digital wallet of your choice to the following address: 17MtNybhdkA9GV3UNS6BTwPcuhjXoPrSzV
Or by scanning the QR code from your wallet:
