Last November I wrote an article about decision trees with Python, which had a set of input data (height, weight and size) and an output of whether the person was a man or a woman. This article adds the visualization of the decision tree, using two Python libraries, pydot and graphviz.
It is assumed that scikit-learn is already installed, so now install pydot and graphviz:
#pip3 install pydot
#pip3 install graphviz
Now the code is shown:
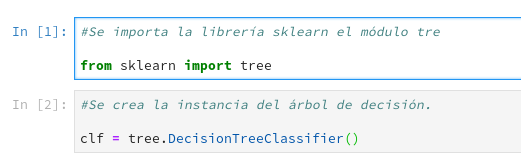
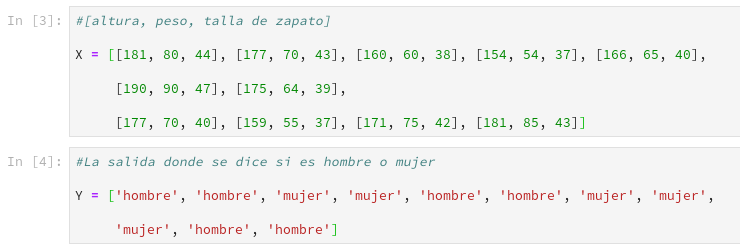
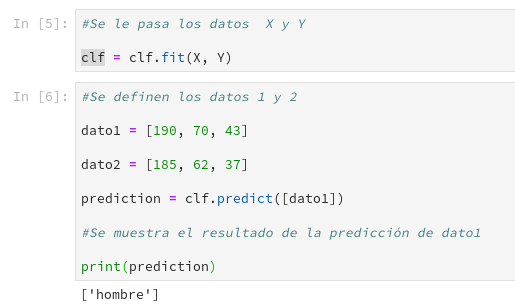
Now it is time to visualize the tree:

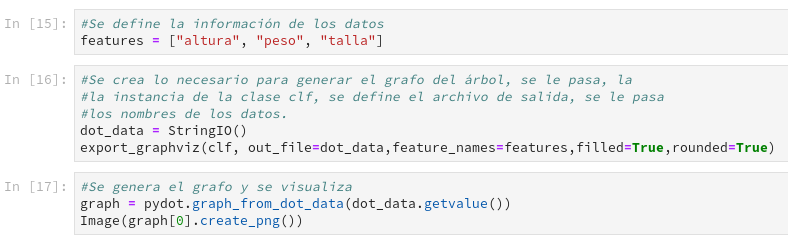
Finally, the graph of the tree is shown:
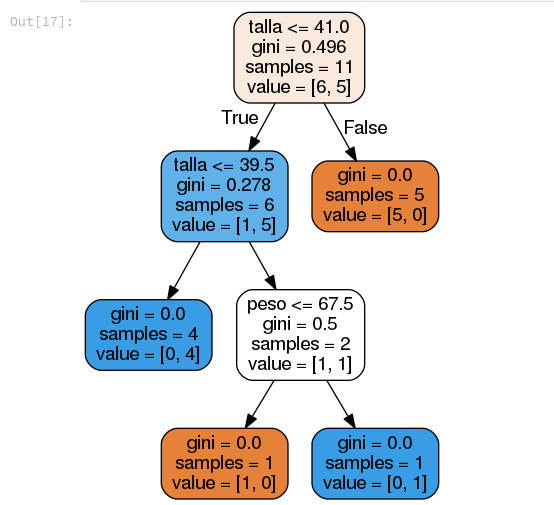
This graph is generated from the instance of the class that is used to enter the data, trained, and then used to predict with new data. The information shown by each decision node:
- Samples: The number of samples being handled.
- gini: An index that indicates the cost of evaluating the split of the data.
- value: A value that is being evaluated at that moment.
You can see the code of this article in the notebook found in the gitlab repository.
The next article will present another example, this time with a larger data set.
If you have any question or comment, you can leave it in the comments of the post.
Make a donation! If you liked the article you can make a donation with Bitcoin (BTC) using the digital wallet of your choice to the following address: 17MtNybhdkA9GV3UNS6BTwPcuhjXoPrSzV
Or by scanning the QR code from the wallet:
