Continuing with the matplotlib tutorials, this time we will see how to place 2 separate plots.
The code is shown below:
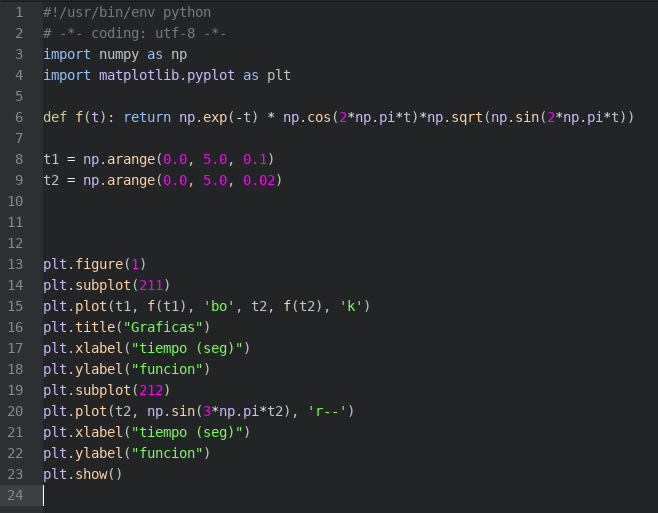
The necessary modules are imported, a function is defined that returns the result of a mathematical calculation, and then the time ranges tiempo1 and tiempo2 are defined.
The figure is defined, then the subplot, and the data to build the first plot is passed to it (tiempo1, the function, the plot label, tiempo2, the function and the plot label).
The title is set on the plot, the axis labels for both plots are set, the second plot is built and both are shown.
The figure shows the 2 plots:
You can download the application code from github at the following link (broken link).
===
Make a donation! If you liked the article you can make a donation with Bitcoin (BTC) using the digital wallet of your choice to the following address: 17MtNybhdkA9GV3UNS6BTwPcuhjXoPrSzV
Or by scanning the QR code from your wallet:
