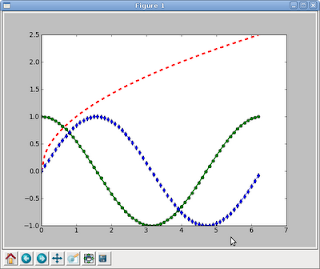
The following example shows how to put several curves on the same plot.
>>> from pylab import *
>>> t=arange(0.,2.*pi,0.1)
>>> s=cos(t)
>>> x=sqrt(t)
>>> y = sin(t)
>>> p1=plot(t,s, 'g-o',linewidth=2)
>>> p2=plot(t,x, 'r--',linewidth=3)
>>> p3=plot(t,y, 'b--d')
>>> show()
The pylab module is imported, then the range of the time axis is defined, the cosine, the square root and the sine are calculated, and then each result is plotted.
===
Make a donation! If you liked the article you can make a donation in Bitcoin (BTC) using the digital wallet of your choice to the following address: 17MtNybhdkA9GV3UNS6BTwPcuhjXoPrSzV
Or by scanning the QR code from your wallet:
