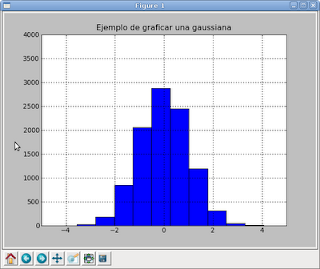
Now I will show how to plot a histogram. The example used is plotting a Gaussian.
>>> from pylab import randn, hist
>>> import matplotlib.pyplot as plt
>>> plt.title("Ejemplo de graficar una gaussiana")
>>> x = randn(10000)
>>> plt.hist(x)
(array([ 26, 182, 846, 2061, 2876, 2449, 1194, 312, 46, 8]), array([-3.56266387, -2.79960319, -2.03654252, -1.27348184, -0.51042117, 0.25263951, 1.01570018, 1.77876086, 2.54182153, 3.30488221, 4.06794288]), )
>>> plt.axis([-5, 5, 0, 4000]) [-5, 5, 0, 4000]
>>> plt.grid(True)
We import random and the histogram function, then matplotlib. We set the title of the plot, generate 10000 random numbers, pass the data to matplotlib, define the axes of the plot and finally add a grid to the plot.
===
Make a donation! If you liked the article you can make a donation with Bitcoin (BTC) using the digital wallet of your choice to the following address: 17MtNybhdkA9GV3UNS6BTwPcuhjXoPrSzV
Or by scanning the QR code from your wallet:
