Now we will see how to define some points on the plot and how to set the range of the axes.
ernesto@zvezda:~/bin$ python2.5
Python 2.5.4 (r254:67916, Feb 17 2009, 20:16:45)
[GCC 4.3.3] on linux2
Type "help", "copyright", "credits" or "license" for more information.
>>> import matplotlib.pyplot as plt
>>> plt.plot([1,2,3,4], [1,4,9,16], 'ro')
[]
>>> plt.axis([0, 6, 0, 20])
[0, 6, 0, 20]
>>> plt.show()
The difference from the previous one is that the coordinates are defined and the 'ro' parameter is passed; this makes the plot show only the points instead of a curve; then the axes are defined from 0 to 6 and from 0 to 20.
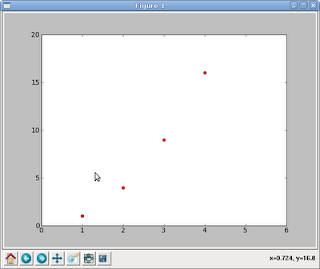
The next example joins the points; to do that, the 'ro' parameter is removed when passing the coordinates:
>>> import matplotlib.pyplot as plt
>>> plt.plot([1,2,3,4], [1,4,9,16])
[]
>>> plt.axis([0, 6, 0, 20])
[0, 6, 0, 20]
>>> plt.show()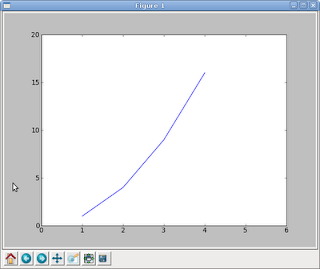
===
Make a donation! If you liked the article you can make a donation with Bitcoin (BTC) using the digital wallet of your choice to the following address: 17MtNybhdkA9GV3UNS6BTwPcuhjXoPrSzV
Or by scanning the QR code from your wallet:
