This article starts level 2 of the series on silverpoint: building a panel with its own style and interaction. Before styling a panel you have to decide which charts it holds, and the catalog has 60.
You do not need to know them all. silverpoint classifies them with two questions, and with them the list shrinks to two or three candidates. This article explains those two questions, walks through the nine families of the catalog and applies them to the first three pieces of data of the operations panel.
The method: two questions
The first question is what shape the rows have. The second, what the reader has to see in them. The order matters: the shape of the data rules out most charts, and the intent chooses among the ones left.
Step 1: the shape of the data
Every chart declares the shape of the data it draws. There are twelve:
| Shape | The rows hold | For example |
|---|---|---|
series | One row per point along an ordered axis (time, sequence) | Hits per hour |
categories | One row per category, with one or more values | Revenue by region |
parts | The parts of one total | Traffic by channel |
matrix | A value for each pair of categories | Errors by day and hour |
hierarchy | One row per node, with its id and its parent | A budget by department |
links | Rows with a source, a target and a value | The steps of a sign-up |
points | Two or more numeric measures per row | Price against rating |
distribution | Many observations of the same measure | Response times |
intervals | A start and an end per row | A task schedule |
events | Dated occurrences, or marks along a cycle | Commits per day |
single | One figure, perhaps with a target | This month's revenue |
field | A measure or a vector over a plane | A wind field |
The shape is read in the rows, not in the topic. Hits per hour are a series because each row is a point along an ordered axis. The same numbers grouped by weekday and time block are a matrix.
Step 2: what the reader has to see
The intent is what the chart has to make evident. silverpoint uses fourteen:
| Intent | The reader has to see |
|---|---|
trend | Where a value is heading |
change | How much it changed between two moments |
compare | Which value is larger |
rank | The order of the categories |
part-to-whole | How much each part weighs in the total |
distribution | How the observations spread |
correlation | Whether two measures move together |
flow | Where a volume goes |
hierarchy | What contains what |
uncertainty | How much margin an estimate has |
progress | How far a target is |
schedule | When each thing happens |
kpi | A figure and its trend, at a glance |
network | Who connects to whom |
One shape admits several intents. With categories, compare leads to a bar chart, change to a dumbbell chart and progress to a bullet chart.
The nine families
The 60 charts are grouped into nine families, by how they draw:
| Family | Charts | Some of them | Usual shapes |
|---|---|---|---|
lines | 4 | line-chart, step-chart, sparkline-rows, kpi-card | series, single |
bars | 8 | bar-chart, stacked-bar-chart, waterfall-chart, funnel-chart | categories |
areas | 3 | area-chart, range-band-chart, stream-chart | series, intervals |
points-grids | 5 | scatter-chart, heatmap-chart, activity-grid | points, matrix, events |
radial | 11 | donut-chart, radar-chart, gauge-arc | parts, categories, single |
flows | 2 | sankey-chart, chord-ring | links |
distributions-comparisons | 14 | histogram-chart, box-plot-chart, dumbbell-chart | distribution, categories, intervals |
hierarchies-dimensions | 8 | squarified-treemap, sunburst-chart, waffle-chart | hierarchy, parts, matrix |
fields-networks | 5 | network-chart, contour-chart, vector-field-chart | points, links, field |
The family is useful to search the documentation and the gallery, but not to choose: a radial chart and a bar chart can answer the same question. To choose, you use the shape and the intent.
The recommendation table
silverpoint keeps a hand-reviewed table that crosses each shape with each intent and scores the candidates from 0 to 1. These are the most frequent pairs in a panel:
| Shape | Intent | The first | The alternatives |
|---|---|---|---|
series | trend | line-chart (0.9) | area-chart (0.8), step-chart (0.6) |
series | kpi | sparkline-rows (0.85) | kpi-card (0.75) |
categories | compare | bar-chart (0.9) | lollipop-chart (0.75), radar-chart (0.5) |
categories | change | dumbbell-chart (0.9) | slope-chart (0.85), waterfall-chart (0.75) |
parts | part-to-whole | donut-chart (0.9) | waffle-chart (0.85), treemap-chart (0.7) |
matrix | compare | heatmap-chart (0.9) | marimekko-chart (0.7) |
distribution | compare | box-plot-chart (0.9) | violin-chart (0.85), ridgeline-chart (0.8) |
intervals | uncertainty | error-bar-chart (0.9) | range-band-chart (0.85) |
links | flow | sankey-chart (0.9) | chord-ring (0.75) |
hierarchy | part-to-whole | squarified-treemap (0.9) | sunburst-chart (0.85) |
The table also takes the volume into account. With more than six parts, the donut loses 0.3 points, because a ring does not read well with that many sectors. With more than twelve categories, the lollipop chart gains 0.2, and the radar, the polar bars and the coxcomb lose 0.3. With more than 500 points, the density bin chart beats the scatter chart.
Applied to the operations panel
The series' panel has three pieces of data to start with. Each one goes through the two questions.
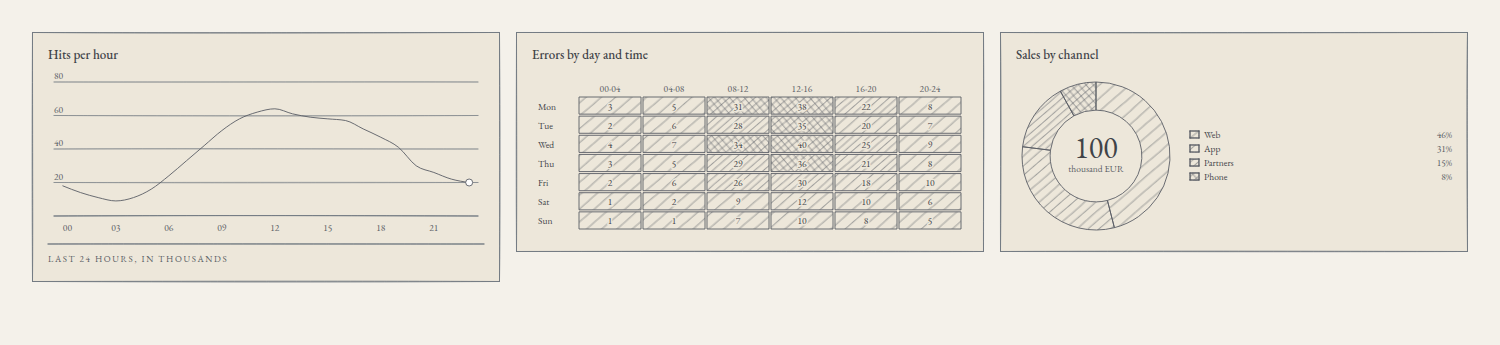
Hits per hour. One row per hour, in order: the shape is series. The reader has to see how traffic evolves during the day: the intent is trend. The first in the table is line-chart, the chart of articles 03 to 07.
Errors by day and time block. Each row is a weekday with six values, one per four-hour block: the shape is matrix. The reader has to compare blocks and days to find where the errors gather: the intent is compare. The first is heatmap-chart.
Sales by channel. Four channels that add up to a total: the shape is parts. The reader has to see how much each channel contributes: the intent is part-to-whole. The first is donut-chart, and with four parts it does not get the six-sector penalty.
The bar chart would be the alternative for sales if the question changed. To compare the channels with each other, or this month with the last one, the data stop being parts of a total and become categories with the intent compare, and there the first is bar-chart. The question decides the chart, not the numbers.
The code in React
The data, in src/panel.ts:
export type HourlyTraffic = { hour: string; hits: number };
export type DailyErrors = { day: string; values: number[] };
export type ChannelSales = { channel: string; sales: number };

export const traffic: HourlyTraffic[] = [
  { hour: '00', hits: 18 }, { hour: '01', hits: 14 }, { hour: '02', hits: 11 },
  { hour: '03', hits: 9 }, { hour: '04', hits: 11 }, { hour: '05', hits: 16 },
  { hour: '06', hits: 24 }, { hour: '07', hits: 33 }, { hour: '08', hits: 42 },
  { hour: '09', hits: 51 }, { hour: '10', hits: 58 }, { hour: '11', hits: 62 },
  { hour: '12', hits: 64 }, { hour: '13', hits: 61 }, { hour: '14', hits: 59 },
  { hour: '15', hits: 58 }, { hour: '16', hits: 57 }, { hour: '17', hits: 52 },
  { hour: '18', hits: 47 }, { hour: '19', hits: 41 }, { hour: '20', hits: 30 },
  { hour: '21', hits: 26 }, { hour: '22', hits: 22 }, { hour: '23', hits: 20 },
];

export const errors: DailyErrors[] = [
  { day: 'Mon', values: [3, 5, 31, 38, 22, 8] },
  { day: 'Tue', values: [2, 6, 28, 35, 20, 7] },
  { day: 'Wed', values: [4, 7, 34, 40, 25, 9] },
  { day: 'Thu', values: [3, 5, 29, 36, 21, 8] },
  { day: 'Fri', values: [2, 6, 26, 30, 18, 10] },
  { day: 'Sat', values: [1, 2, 9, 12, 10, 6] },
  { day: 'Sun', values: [1, 1, 7, 10, 8, 5] },
];

export const blocks = ['00-04', '04-08', '08-12', '12-16', '16-20', '20-24'];

export const sales: ChannelSales[] = [
  { channel: 'Web', sales: 46 },
  { channel: 'App', sales: 31 },
  { channel: 'Partners', sales: 15 },
  { channel: 'Phone', sales: 8 },
];
The three charts, in src/App.tsx:
import { DonutChart } from '@silverpoint/react/donut-chart';
import { HeatmapChart } from '@silverpoint/react/heatmap-chart';
import { LineChart } from '@silverpoint/react/line-chart';
import { blocks, errors, sales, traffic } from './panel';

export default function App() {
  return (
    <main className="panel">
      <LineChart
        data={traffic}
        xKey="hour"
        valueKey="hits"
        title="Hits per hour"
        footerLeft="Last 24 hours, in thousands"
      />
      <HeatmapChart
        data={errors}
        labelKey="day"
        valuesKey="values"
        columnLabels={blocks}
        scaleMax={40}
        title="Errors by day and time"
      />
      <DonutChart
        data={sales}
        nameKey="channel"
        valueKey="sales"
        centerLabel="thousand EUR"
        title="Sales by channel"
      />
    </main>
  );
}
And a grid to place them, in src/index.css:
body {
  margin: 0;
  padding: 32px;
  background: #f4f1ea;
}

.panel {
  display: grid;
  grid-template-columns: repeat(auto-fit, minmax(320px, 1fr));
  gap: 16px;
}
Each chart has its own accessors, which depend on its shape:
| Chart | Accessors | Other props |
|---|---|---|
LineChart | xKey, valueKey | secondaryKey for a second, dotted series |
HeatmapChart | labelKey, valuesKey | columnLabels, the names of the columns; scaleMax, the value of the darkest tone |
DonutChart | nameKey, valueKey | centerValue and centerLabel, the centre of the ring; legend |
Two details of this version:
- The heatmap's
scaleMaxis 100 by default. The errors do not go past 40, so with the default every cell would stay in the light tones. WithscaleMax={40}, the cell holding 40 gets the densest hatching. - The centre of the donut shows the total. Without
centerValue, the ring writes the sum of the parts, 100, and the legend gives each channel's percentage.
The code in Reflex
The data, in ops_panel/panel.py:
TRAFFIC = [
    {"hour": "00", "hits": 18}, {"hour": "01", "hits": 14}, {"hour": "02", "hits": 11},
    {"hour": "03", "hits": 9}, {"hour": "04", "hits": 11}, {"hour": "05", "hits": 16},
    {"hour": "06", "hits": 24}, {"hour": "07", "hits": 33}, {"hour": "08", "hits": 42},
    {"hour": "09", "hits": 51}, {"hour": "10", "hits": 58}, {"hour": "11", "hits": 62},
    {"hour": "12", "hits": 64}, {"hour": "13", "hits": 61}, {"hour": "14", "hits": 59},
    {"hour": "15", "hits": 58}, {"hour": "16", "hits": 57}, {"hour": "17", "hits": 52},
    {"hour": "18", "hits": 47}, {"hour": "19", "hits": 41}, {"hour": "20", "hits": 30},
    {"hour": "21", "hits": 26}, {"hour": "22", "hits": 22}, {"hour": "23", "hits": 20},
]

ERRORS = [
    {"day": "Mon", "values": [3, 5, 31, 38, 22, 8]},
    {"day": "Tue", "values": [2, 6, 28, 35, 20, 7]},
    {"day": "Wed", "values": [4, 7, 34, 40, 25, 9]},
    {"day": "Thu", "values": [3, 5, 29, 36, 21, 8]},
    {"day": "Fri", "values": [2, 6, 26, 30, 18, 10]},
    {"day": "Sat", "values": [1, 2, 9, 12, 10, 6]},
    {"day": "Sun", "values": [1, 1, 7, 10, 8, 5]},
]

BLOCKS = ["00-04", "04-08", "08-12", "12-16", "16-20", "20-24"]

SALES = [
    {"channel": "Web", "sales": 46},
    {"channel": "App", "sales": 31},
    {"channel": "Partners", "sales": 15},
    {"channel": "Phone", "sales": 8},
]
The page, in ops_panel/ops_panel.py:
import reflex as rx
from reflex_silverpoint_react import donut_chart, heatmap_chart, line_chart

from .panel import BLOCKS, ERRORS, SALES, TRAFFIC


def index() -> rx.Component:
    return rx.grid(
        line_chart(
            data=TRAFFIC,
            x_key="hour",
            value_key="hits",
            title="Hits per hour",
            footer_left="Last 24 hours, in thousands",
        ),
        heatmap_chart(
            data=ERRORS,
            label_key="day",
            values_key="values",
            column_labels=BLOCKS,
            scale_max=40,
            title="Errors by day and time",
        ),
        donut_chart(
            data=SALES,
            name_key="channel",
            value_key="sales",
            center_label="thousand EUR",
            title="Sales by channel",
        ),
        columns="3",
        gap="16px",
        padding="32px",
    )


app = rx.App()
app.add_page(index)
rx.grid splits the width into three columns, and each chart takes the width of its own.
In Vue and in Angular
The same three charts, with each adapter's names:
| Chart | Vue | Angular |
|---|---|---|
| Line | SpLineChart, from @silverpoint/vue/line-chart | <sp-line-chart>, from @silverpoint/angular/line-chart |
| Heatmap | SpHeatmapChart, from @silverpoint/vue/heatmap-chart | <sp-heatmap-chart>, from @silverpoint/angular/heatmap-chart |
| Donut | SpDonutChart, from @silverpoint/vue/donut-chart | <sp-donut-chart>, from @silverpoint/angular/donut-chart |
The props are the same, with the syntax of article 07: :column-labels="blocks" and :scale-max="40" in Vue, [columnLabels]="blocks" and [scaleMax]="40" in Angular.
The same table, for an AI assistant
The recommendation table is not a model: it is a reviewed list, and the silverpoint MCP server exposes it with the recommend_chart tool. With the shape parts, the intent part-to-whole and four rows, it answers the same as this article: donut-chart with 0.9, waffle-chart with 0.85 and treemap-chart with 0.7. The MCP server has its own article, 28.
What comes next
You now have the panel's first three charts and a method to choose the next ones. Article 09 gives them a common style: the grounds, the substrates and the provider that sets the style of the whole application in one place.
The 60 charts can be seen live in the gallery.