Part 3 of the graph creation series shows the types of graphs that exist, part 2 shows how to get data from a file containing the relationships between the characters of the novel Les Misérables, and part 1 shows how to create graphs.
This article takes the file from part 2 to obtain the most influential nodes of the graph, those most linked to other characters in the novel.
This article is based on the English article Betweenness Centrality.
The networkx library will be used to read the information from the file lesmiserables.gml (broken link) , and betweenness centrality will be used to obtain the most influential nodes.
Betweenness centrality focuses on the number of visits through the shortest paths.
Betweenness centrality is defined as:
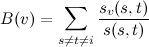
Where s(s,t) is the total number of shortest paths from node s to node t, and sv(s,t) is the number of those paths that pass through v.
Here is the python code that calculates the most influential nodes using betweenness centrality:
#!/usr/bin/env python

import networkx as nx

from pylab import show, hist, figure

#Leer los datos del archivo lesmiserables.gml

G = nx.read_gml('lesmiserables.gml',relabel=True)

#Funcion que devuelve los nodos mas importantes

def most_important(G):

 """ retorna una copia de G con los nodos mas importantes(mas influencia, conexion entre nodos) """

    #Se calcula el ranking segun la centralidad

    ranking = nx.betweenness_centrality(G).items(

    #Se imprime los nodos mas importantes

    print ranking

    r = [x[1] for x in ranking]

    m = sum(r)/len(r) # centralidad

    t = m*3 # se mantiene los nodos  con promedio de aparicion de 3 veces


    Gt = G.copy()


    #Se remueve los nodos que no aparecen


    for k, v in ranking:


        if v < t:


            Gt.remove_node(k)


    #Se retorna los nodos mas importantes


    return Gt

#Se recibe los nodos mas importantes


Gt = most_important(G) # trimming

# se crea el layout


pos = nx.spring_layout(G)


#Se dibuja los nodos y sus bordes


nx.draw_networkx_nodes(G,pos,node_color='b',alpha=0.2,node_size=8)


nx.draw_networkx_edges(G,pos,alpha=0.1)

#Se dibuja los nodos mas importantes con un estilo diferente


nx.draw_networkx_nodes(Gt,pos,node_color='r',alpha=0.4,node_size=254)


# se define las etiquetas


nx.draw_networkx_labels(Gt,pos,font_size=12,font_color='b')


#Se muestra la grafica


show()
The plot showing the most influential characters in the novel Les Misérables is shown below:
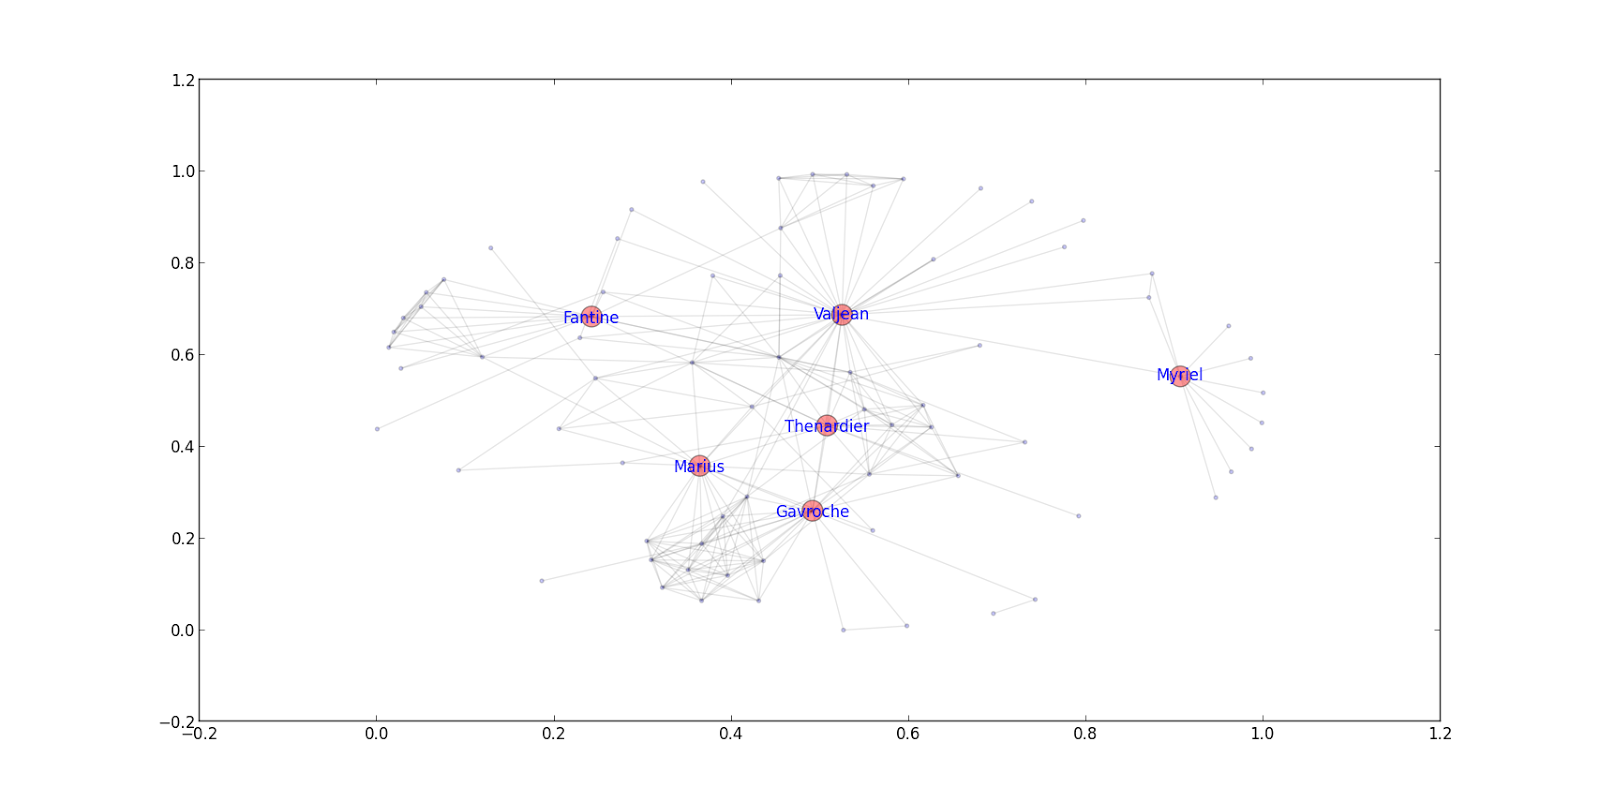
This is useful when managing influence in social networks such as twitter.
Make a donation! If you liked the article you can make a donation in Bitcoin (BTC) using the digital wallet of your choice to the following address: 17MtNybhdkA9GV3UNS6BTwPcuhjXoPrSzV
Or by scanning the QR code from your wallet:
