This article is based on the English article "How to plot a function of two variables with matplotlib".
There will be 2 plots of a function of 2 variables: the first will be an intensity plot and the second will be a 3D plot.
The code is shown below:
#!/usr/bin/env python

#De numpy se explorta arange y exp

from numpy import exp,arange

#De pylab se importa meshgrid, cm, imshow, contour, clabel, clorbar, axis, title y show

from pylab import meshgrid,cm,imshow,contour,clabel,colorbar,axis,title,show

from mpl_toolkits.mplot3d import Axes3D

from matplotlib import cm

from matplotlib.ticker import LinearLocator, FormatStrFormatter

import matplotlib.pyplot as plt

#Se define la funcion que se va a graficar

def z_func(x,y):

    return (1-(x**2+y**3))*exp(-(x**2+y**2)/2)

def graficaIntencidad(Z):

    #Se dibuja la funcion

    im = imshow(Z,cmap=cm.RdBu)

    #Se agrega el contorno de lineas con sus etiquetas

    cset = contour(Z,arange(-1,1.5,0.2),linewidths=2,cmap=cm.Set2)

    clabel(cset,inline=True,fmt='%1.1f',fontsize=10)

    #Se agrega la barra de colores a la derecha

    colorbar(im)

    #Se crea el titulo de la grafica con estilo latex

    title('$z=(1-x^2+y^3) e^{-(x^2+y^3)/2}$')

    #Se muestra la grafica

    show()

def grafica3D(X,Y,Z):

    fig = plt.figure()

    ax = fig.gca(projection='3d')

    surf = ax.plot_surface(X, Y, Z, rstride=1, cstride=1,

                           cmap=cm.RdBu,linewidth=0, antialiased=False)

    ax.zaxis.set_major_locator(LinearLocator(10))

    ax.zaxis.set_major_formatter(FormatStrFormatter('%.02f'))

    fig.colorbar(surf, shrink=0.5, aspect=5)

    plt.show()

if __name__ == '__main__':

    #rango de valores para x y y.

    x = arange(-3.0,3.0,0.1)

    y = arange(-3.0,3.0,0.1)

    #Se define la grilla de puntos

    X,Y = meshgrid(x, y)

    #Se evalua la funcion segun los valores de X y Y

    Z = z_func(X, Y)

    graficaIntencidad(Z)

    grafica3D(X,Y,Z)
When the script is run, the first plot will be shown, and when it is closed the second plot will appear.
The intensity plot is shown below:
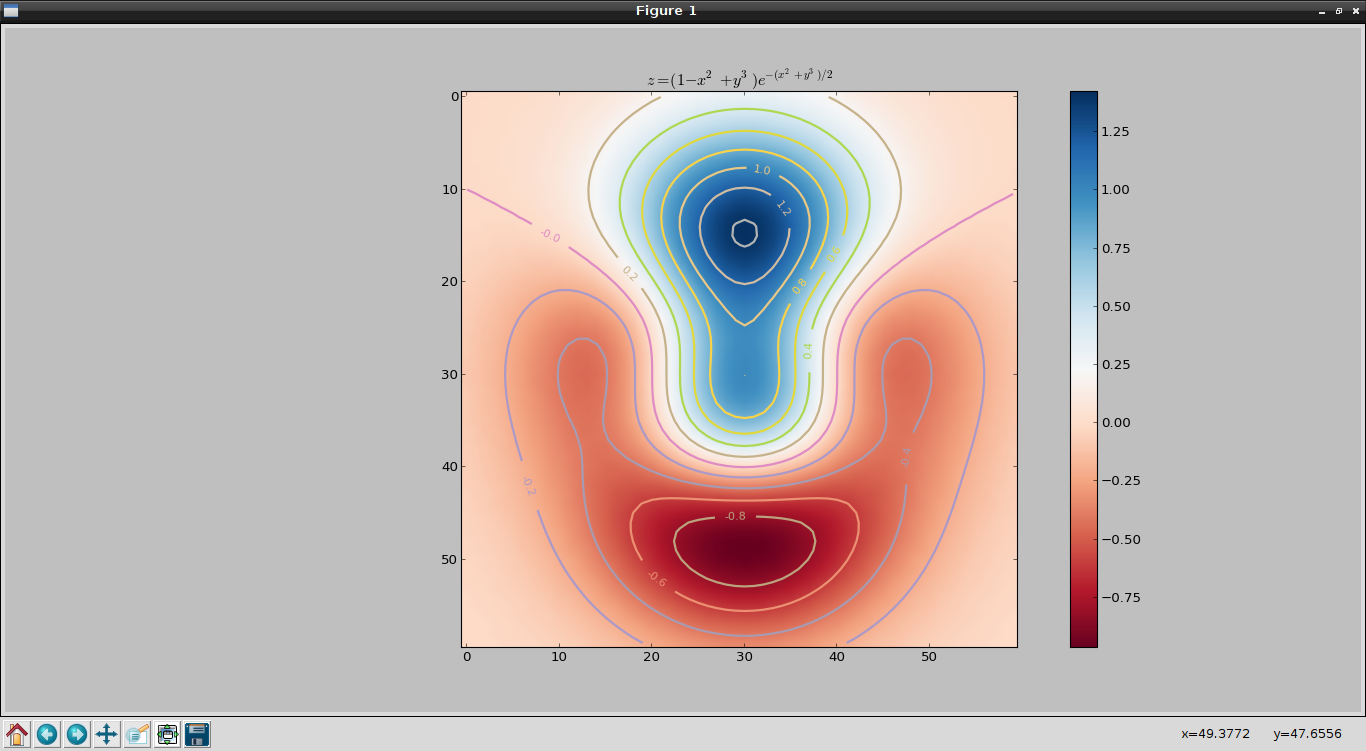
The 3D plot is shown below:
Make a donation! If you liked the article you can make a donation with Bitcoin (BTC) using the digital wallet of your choice to the following address: 17MtNybhdkA9GV3UNS6BTwPcuhjXoPrSzV
Or by scanning the QR code from your wallet:
