This article is based on the article "Visualizing the tangent" .
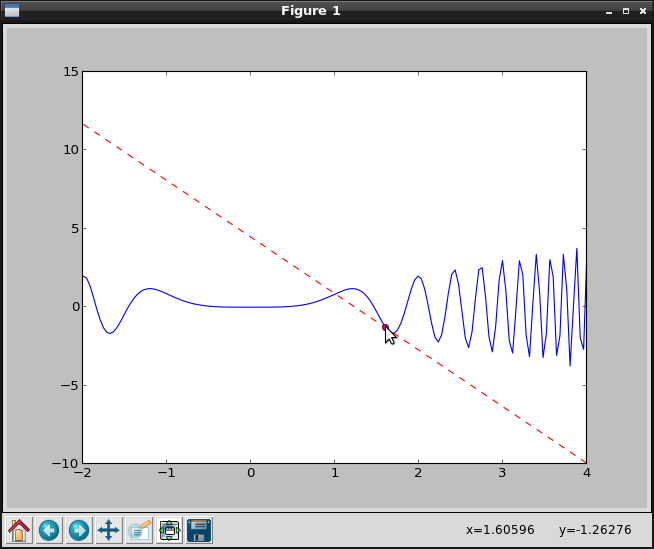
The tangent of a curve is a straight line that touches the curve at a point. This straight line gives the slope of the curve. If the curve represents a time series, you can tell the rate of change of the values just by looking at the tangent.
Suppose the curve is given as the graph of the function y = f(x); the slope of the curve at the point (a,f(a)) is equal to its derivative at a

and the equation of the tangent line can be stated as

Below is the code for the tangent of x*sen(x^3) at the point 1.6:
#!/usr/bin/env python
#De numpy se importa sin, linspace y power
from numpy import sin,linspace,power
#De pylab se importa plot y show
from pylab import plot,show

#Se define la funcion de la curva
def f(x): # sample function
 return x*sin(power(x,3))

# Se evalua la funcion en el rango de -2 a 4 con 150 intervalos
x = linspace(-2,4,150)
#Se le pasa a la funcion los valores definidos en x.
y = f(x)

#Se le pasa el punto a calcular la tangente de la curva.
a = 1.6
#Se le pasa el diferencial con un valor de 0.1
h = 0.1
#Se calcula la derivada.
fprime = (f(a+h)-f(a))/h # derivative
#Se calcula la tangente
tan = f(a)+fprime*(x-a)  # tangent

# Se grafica la funcion y la tangente.
plot(x,y,'b',a,f(a),'om',x,tan,'--r')
#Se muestra la grafica.
show()
The plots that are generated are shown below:
The original article shows another example.
Make a donation! If you liked the article you can make a donation with Bitcoin (BTC) using the digital wallet of your choice to the following address: 17MtNybhdkA9GV3UNS6BTwPcuhjXoPrSzV
Or by scanning the QR code from your wallet:
