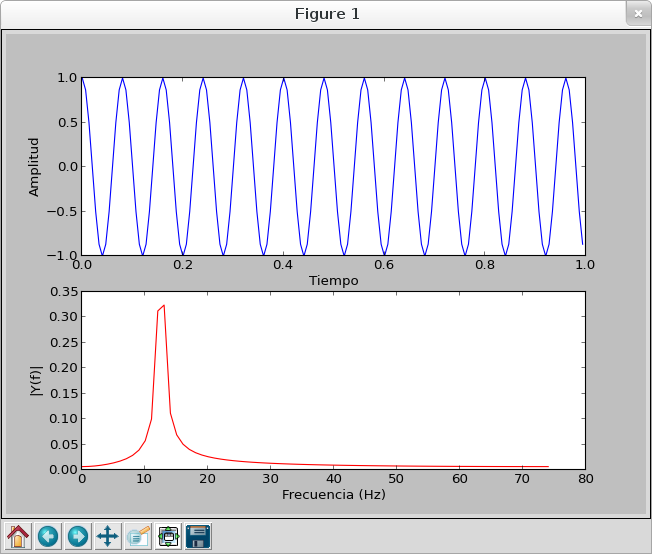
This article explains how to take a signal in the time domain and plot it in the frequency domain.
This article is based on an English article called "How to plot the frequency spectrum with scipy".
Frequency analysis is the process of determining the representation in the frequency domain of a time-domain signal, commonly using the Fourier Transform .
The Discrete Fourier Transform (DFT) is used to determine the frequency content of signals, and the Fast Fourier Transform (FFT) is an efficient method for computing the Discrete Fourier Transform. Scipy implements the FFT and it will be used to analyze the frequency spectrum.
The code that plots the amplitude in the frequency domain of the time-domain cosine function is shown below:
#!/usr/bin/env python

# -*- coding: utf-8 -*-

#Importa  coseno, linspace y pi

from numpy import cos, linspace, pi

#Importa plot, show, title, xlabel, ylabel y subplot para graficar

from pylab import plot, show, title, xlabel, ylabel, subplot

#Importa fft y arange

from scipy import fft, arange

#

def plotSpectrum(y,Fs):

 """

 grafica la amplitud del espectro de y(t)

 """

 n = len(y) # longitud de la señal

 k = arange(n)

 T = n/Fs

 frq = k/T # 2 lados del rango de frecuancia

 frq = frq[range(n/2)] # Un lado del rango de frecuencia


 Y = fft(y)/n # fft calcula la normalizacion

 Y = Y[range(n/2)]


 plot(frq,abs(Y),'r') # grafica el espectro de frecuencia

 xlabel('Frecuencia (Hz)')

 ylabel('|Y(f)|')

if __name__ == '__main__':

    Fs = 150.0;  # rata de muestreo

    Ts = 1.0/Fs; # intevalo de muestreo

    t = arange(0,1,Ts) # vector tiempo

    ff = 5;   # frecuencia de la señal

    y = cos(5*pi*ff*t)

 #Proceso de graficar la señal

    subplot(2,1,1)

    plot(t,y)

    xlabel('Tiempo')

    ylabel('Amplitud')

    subplot(2,1,2)

    #Se llama a la funcion con la señal y la rata de muestreo

    plotSpectrum(y,Fs)

    show()
Running the script generates the following plot:
Make a donation! If you liked the article you can make a donation with Bitcoin (BTC) using the digital wallet of your choice at the following address: 17MtNybhdkA9GV3UNS6BTwPcuhjXoPrSzV
Or by scanning the QR code from your wallet:
