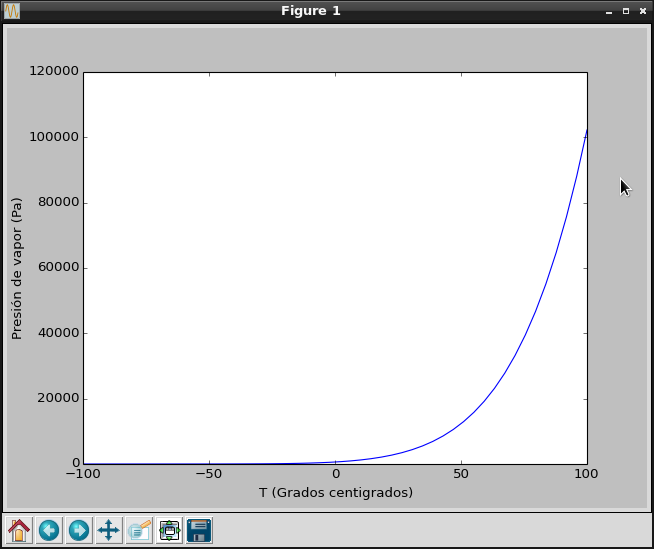
Returning to the numpy and matplotlib articles, this time a plot of the water vapor calculation between -100 and 100 degrees Celsius will be shown.
The vapor equation is the following:
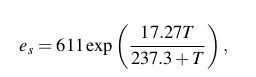
Where es is in pascal and T in degrees Celsius.
The code to generate the plot is shown below:
#!/usr/bin/env python3


# -*- coding: utf-8 -*-


#Se importa numpy como np


import numpy as np


#Se importa xlabel, ylabel, plot y show de pylab


from pylab import xlabel,ylabel, plot, show


#Se define el rango de la temperatura, de -100 a 100 con


#incrementos de 50.


T = np.linspace(-100,100,50)


#Se realiza el cálculo de la presión pasandole el arreglo de valores de


#la temperatura


es = 611*np.exp(17.27*T/(237.3+T))


#Se crea la gráfica


plot(T,es)


#Se define las etiquetas de los ejes X y Y.


xlabel('T (Grados centigrados)')


ylabel(u'Presión de vapor (Pa)')


#Se muestra la gráfica

show()
The plot is shown below:
Make a donation! If you liked the article you can make a donation with Bitcoin (BTC) using the digital wallet of your choice to the following address: 17MtNybhdkA9GV3UNS6BTwPcuhjXoPrSzV
Or by scanning the QR code from the wallet:
