Today's article explains how to create a 3D plot with Python.
This article is based on the article in English 3D Stem plot.
For this case there are two files in a github repository, one python and the other a jupyter notebook.
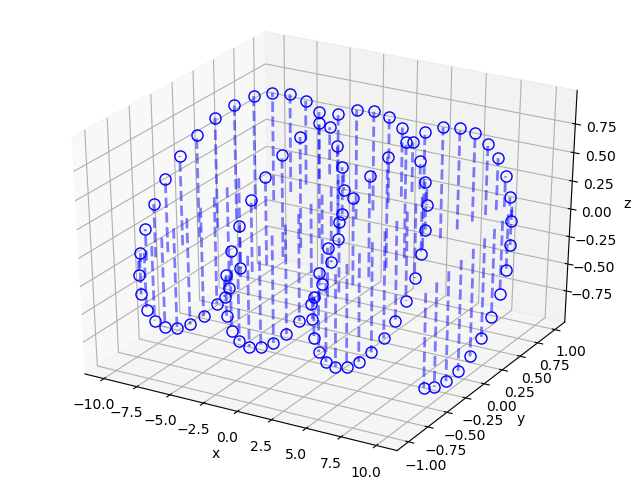
A variable x will be generated that defines the time axis of two plots (sine and cosine) and then they are plotted as a 3D plot.
Here is the code:
#!/usr/bin/env python3


# # Se importan las librerías necesarias


from numpy import linspace, sin, cos

from pylab import figure, show

from mpl_toolkits.mplot3d import Axes3D


# # generando algunos datos

x = linspace(-10,10,100);

y = sin(x);

z = cos(x);


# # Se crea la instancia de la figura y se asocia a la figura 3D

fig = figure()

ax = Axes3D(fig)


# # graficando los datos

for i in range(len(x)):

  ax.plot([x[i], x[i]], [y[i], y[i]], [0, z[i]],

          '--', linewidth=2, color='b', alpha=.5)


# # graficando un circulo en el tope de cada curva

# plotting a circle on the top of each stem

ax.plot(x, y, z, 'o', markersize=8,

        markerfacecolor='none', color='b',label='ib')

ax.set_xlabel('x')

ax.set_ylabel('y')

ax.set_zlabel('z')

show()
Running the script produces the following plot.
Make a donation! If you liked the article you can make a donation with Bitcoin (BTC) using the digital wallet of your choice to the following address: 17MtNybhdkA9GV3UNS6BTwPcuhjXoPrSzV
Or by scanning the QR code from the wallet:
