Continuing with the libraries for generating graphics in Python, I will now explain how to use Qt's PyQwt library to create plots.
This example is based on the introduction on the official PyQwt page. In this case the range of the array and the functions to plot were changed.
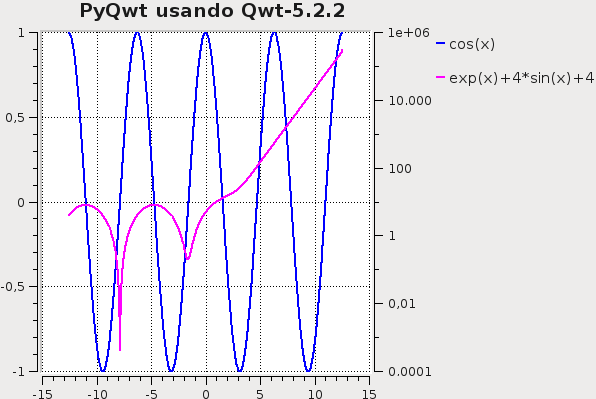
In the example, the range of values is created with numpy, then an instance of the QApplication class is created in order to build the 2 curves and then save the plot to a file in .png format.
The code is shown below:
#!/usr/bin/env python
#Importar numpy
import numpy as np
#Importar las librerias Qt
from PyQt4.Qt import *
#Importar las librerias Qwt5
from PyQt4.Qwt5 import *
#De Qwt5 importar qplt
from PyQt4.Qwt5.qplt import *
#Importar sleep
from time import sleep

#Instanciar la clase QApplication
application = QApplication([])

# Crea un arreglo desde -4PI a 4Pi en incrementos de 0.01
x = np.arange(-4*np.pi, 4*np.pi, 0.01)

#Crea 2 curvas con el eje vertical en escala logaritmica.
p = Plot(Curve(x, np.cos(x), Pen(Blue, 2), "cos(x)"),
Curve(x, np.exp(x)+4+4*np.sin(x), Pen(Magenta,2), "exp(x)+4*sin(x)+4",Y2),
Axis(Y2, Log),"PyQwt usando Qwt-%s " % QWT_VERSION_STR)

#Hace una captura de pantalla de la imagen y lo guarda en un archivo con formato PNG
QPixmap.grabWidget(p).save('cli-plot-1.png', 'PNG')
The generated plot is shown in the following figure:
Make a donation! If you liked the article you can make a donation with Bitcoin (BTC) using the digital wallet of your choice to the following address: 17MtNybhdkA9GV3UNS6BTwPcuhjXoPrSzV
Or by scanning the QR code from your wallet:
