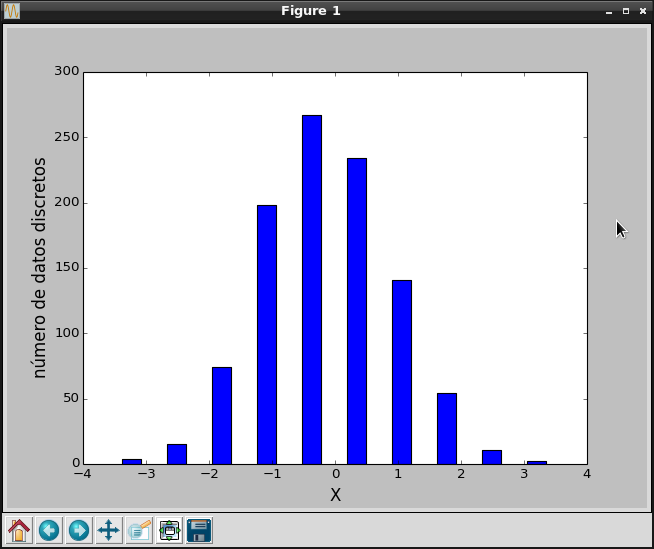
The article on creating graphs shows how to generate a histogram; now a histogram will be shown with generated data.
Random data will be generated, and the histogram will be built from it with the scipy.stats.histogram function, and then the histogram is plotted.
The program code is shown below:
#!/usr/bin/env python3


# -*- coding: utf-8 -*-


#Se importa numpy como np


import numpy as np


import matplotlib.pyplot as plt


import scipy.stats as st


#Se importa pylab


from pylab import *


#Generación de números aleatorios menores que 1000


x = np.random.randn(1000)


#Generación de los datos del histograma con scipy.stats.


n, low_range, binsize, extrapoints = st.histogram(x)


#define el rango superior


upper_range = low_range+binsize*(len(n)-1)


#Se calcula los intervalos discretos


bins = np.linspace(low_range, upper_range, len(n))


#Generación del gráfico de barras


bar(bins, n, width=0.3, color='blue')


#Etiquetas de los ejes X y Y.


xlabel('X', fontsize=15)


ylabel('número de datos discretos', fontsize=15)


#Se muestra la gráfica.

show()
The plot is shown below:
Make a donation! If you liked the article you can make a donation with Bitcoin (BTC) using the digital wallet of your choice to the following address: 17MtNybhdkA9GV3UNS6BTwPcuhjXoPrSzV
Or by scanning the QR code from the wallet:
