Continuing with the articles about data science, this time data on global and per-country climate information, as well as CO2 levels, will be analyzed.
I found this data and project on the kaggle (broken link) site, which is a site for publishing data science projects. You can find the data for this article at the following link (broken link).
The code in this article is based on the article on kaggle on the subject, in English: Climate Change and CO2 levels in atmosphere (broken link).
This article explores the global changes in mean temperature and the increase in the concentration of CO2 in the atmosphere.
The data comes from the following files:
- GlobalLandTemperaturesByCountry.csv: Contains the temperature information by country.
- GlobalTemperatures.csv: Contains the global temperature information.
- archive.csv: Contains the information on CO2 levels in the atmosphere.
The notebook is shown below:
https://www.kaggle.com/derevirn/data-analysis-on-climate-change/notebook (broken link) https://www.kaggle.com/derevirn/data-analysis-on-climate-change/data (broken link)
Import the pandas, matplotlib and seaborn libraries.
In [1]:
import pandas as pd
import matplotlib.pyplot as plt
import seaborn as sns
Create the dataframes from the csv files.
In [2]:
# Se crea el dataframe data_pais, data_vzla, data_global y co2_ppm

data_pais = pd.read_csv("./datos/GlobalLandTemperaturesByCountry.csv")
#Se crea una copia del dataframe obteniendo solo la información de Venezuela.
data_vzla = data_pais[data_pais["Country"] == "Venezuela"].copy()
data_vzla["dt"] = pd.to_datetime(data_vzla["dt"])

#Se crea una copia del dataframe obteniendo solo la información de Argentina.
data_arg = data_pais[data_pais["Country"] == "Argentina"].copy()
data_arg["dt"] = pd.to_datetime(data_arg["dt"])

#Se crea una copia del dataframe obteniendo solo la información de USA.
data_canada = data_pais[data_pais["Country"] == "Canada"].copy()
data_canada["dt"] = pd.to_datetime(data_canada["dt"])

#Se crea una copia del dataframe obteniendo solo la información de Mexico.
data_mexico = data_pais[data_pais["Country"] == "Mexico"].copy()
data_mexico["dt"] = pd.to_datetime(data_mexico["dt"])

#Se crea una copia del dataframe obteniendo solo la información de Brasil.
data_brasil = data_pais[data_pais["Country"] == "Brazil"].copy()
data_brasil["dt"] = pd.to_datetime(data_brasil["dt"])

#Se crea una copia del dataframe obteniendo solo la información de Venezuela.
data_chile = data_pais[data_pais["Country"] == "Chile"].copy()
data_chile["dt"] = pd.to_datetime(data_chile["dt"])

#Se crea el dataframe de la temperatura global.
data_global = pd.read_csv("./datos/GlobalTemperatures.csv")
#Se modifica la fecha y hora como datetime.
data_global["dt"] = pd.to_datetime(data_global["dt"])
#Se crea el dataframe del co2.
co2_ppm = pd.read_csv("./datos/archive.csv")
The dataframes created.
In [3]:
data_pais.head()Out[3]:
| ID | dt | Average Temperature | Average Temperature Uncertainty | Country |
|---|---|---|---|---|
| 0 | 1743-11-01 | 4.384 | 2.294 | Åland |
| 1 | 1743-12-01 | NaN | NaN | Åland |
| 2 | 1744-01-01 | NaN | NaN | Åland |
| 3 | 1744-02-01 | NaN | NaN | Åland |
| 4 | 1744-03-01 | NaN | NaN | Åland |
As can be seen, there is the date, the average temperature, the average temperature uncertainty and the country. In [4]:
data_pais.info()
<class 'pandas.core.frame.DataFrame'>
RangeIndex: 577462 entries, 0 to 577461
Data columns (total 4 columns):
dt                               577462 non-null object
AverageTemperature               544811 non-null float64
AverageTemperatureUncertainty    545550 non-null float64
Country                          577462 non-null object
dtypes: float64(2), object(2)
memory usage: 17.6+ MB
The data types of the columns are: dt is object, average temperature and average temperature uncertainty are float64, and country is object
Venezuela
In [5]:
data_vzla.head()Out[5]:
| ID | dt | Average Temperature | Average Temperature Uncertainty | Country |
|---|---|---|---|---|
| 562339 | 1824-01-01 | 24.613 | 0.824 | Venezuela |
| 562340 | 1824-02-01 | 24.670 | 2.017 | Venezuela |
| 562341 | 1824-03-01 | 25.527 | 1.065 | Venezuela |
| 562342 | 1824-04-01 | 25.732 | 1.771 | Venezuela |
| 562343 | 1824-05-01 | 24.999 | 1.157 | Venezuela |
This is the same information as above but only for Venezuela. In [6]:
data_vzla.describe().TOut[6]:
| count | mean | std | min | 25% | 50% | 75% | max | |
|---|---|---|---|---|---|---|---|---|
| AverageTemperature | 2086.0 | 25.025686 | 0.703189 | 22.777 | 24.52325 | 24.9825 | 25.49525 | 27.807 |
| AverageTemperatureUncertainty | 2086.0 | 0.586000 | 0.398460 | 0.084 | 0.31000 | 0.4540 | 0.76000 | 4.120 |
There are 2086 data points, for which the average temperature is 25.025 degrees and the uncertainty is 0.586; the standard deviation of the average temperature is 0.703 and of the uncertainty is 0.398; the minimum temperature was 22.77 and the maximum 27.807. In [7]:
data_vzla.corr()Out[7]:
| | AverageTemperature | AverageTemperatureUncertainty | |:--------------------------- - | :---------------: | :---------------------------: | |AverageTemperature | 1.000000 | -0.319882 | |AverageTemperatureUncertainty | -0.319882 | 1.000000 |
The two variables are, to a certain extent, inversely correlated. Argentina In [8]:
data_arg.head()Out[8]:
| ID | dt | Average Temperature | Average Temperature Uncertainty | Country |
|---|---|---|---|---|
| 25466 | 1855-05-01 | 10.745 | 1.499 | Argentina |
| 25467 | 1855-06-01 | 6.995 | 2.073 | Argentina |
| 25468 | 1855-07-01 | 6.901 | 1.568 | Argentina |
| 25469 | 1855-08-01 | 9.097 | 1.412 | Argentina |
| 25470 | 1855-09-01 | 11.316 | 1.384 | Argentina |
In [9]:
data_arg.describe().TOut[9]:
| count | mean | std | min | 25% | 50% | 75% | max | |
|---|---|---|---|---|---|---|---|---|
| AverageTemperature | 1900.0 | 14.621194 | 4.846885 | 4.796 | 10.13225 | 14.6305 | 19.27875 | 23.290 |
| AverageTemperatureUncertainty | 1900.0 | 0.527338 | 0.465652 | 0.083 | 0.20900 | 0.3035 | 0.74525 | 2.974 |
Brazil
In [10]:
data_brasil.head()Out[10]:
| ID | dt | Average Temperature | Average Temperature Uncertainty | Country |
|---|---|---|---|---|
| 77110 | 1832-01-01 | 24.935 | 1.372 | Brazil |
| 77111 | 1832-02-01 | 24.505 | 1.953 | Brazil |
| 77112 | 1832-03-01 | 24.617 | 1.359 | Brazil |
| 77113 | 1832-04-01 | 23.990 | 2.013 | Brazil |
| 77114 | 1832-05-01 | 23.124 | 1.592 | Brazil |
In [11]:
data_brasil.describe().TOut[11]:
| count | mean | std | min | 25% | 50% | 75% | max | |
|---|---|---|---|---|---|---|---|---|
| AverageTemperature | 2164.0 | 24.699256 | 0.978787 | 21.797 | 24.02250 | 24.8295 | 25.44975 | 27.151 |
| AverageTemperatureUncertainty | 2164.0 | 0.572940 | 0.411794 | 0.060 | 0.24375 | 0.4160 | 0.84000 | 3.353 |
Chile
In [12]:
data_chile.head()Out[12]:
| ID | dt | AverageTemperature | AverageTemperatureUncertainty | Country |
|---|---|---|---|---|
| 108248 | 1855-05-01 | 7.152 | 1.296 | Chile |
| 108249 | 1855-06-01 | 4.257 | 1.641 | Chile |
| 108250 | 1855-07-01 | 4.113 | 1.313 | Chile |
| 108251 | 1855-08-01 | 5.508 | 1.168 | Chile |
| 108252 | 1855-09-01 | 6.684 | 1.153 | Chile |
In [13]:
data_chile.describe().TOut[13]:
| count | mean | std | min | 25% | 50% | 75% | max | |
|---|---|---|---|---|---|---|---|---|
| AverageTemperature | 1900.0 | 9.383474 | 3.179081 | 3.206 | 6.502 | 9.3815 | 12.37775 | 15.493 |
| AverageTemperatureUncertainty | 1900.0 | 0.572654 | 0.418011 | 0.114 | 0.281 | 0.3825 | 0.80300 | 2.408 |
Mexico
In [14]:
data_mexico.head()Out[14]:
| ID | dt | AverageTemperature | AverageTemperatureUncertainty | Country |
|---|---|---|---|---|
| 338438 | 1835-01-01 | 15.810 | 1.484 | Mexico |
| 338438 | 1835-01-01 | 15.810 | 1.484 | Mexico |
| 338439 | 1835-02-01 | 14.911 | 1.579 | Mexico |
| 338440 | 1835-03-01 | 16.826 | 1.858 | Mexico |
| 338441 | 1835-04-01 | 19.925 | 1.966 | Mexico |
| 338442 | 1835-05-01 | 22.037 | 1.609 | Mexico |
In [15]:
data_mexico.describe().TOut[15]:
| count | mean | std | min | 25% | 50% | 75% | max | |
|---|---|---|---|---|---|---|---|---|
| AverageTemperature | 2145.0 | 20.567558 | 3.753343 | 12.064 | 17.109 | 21.050 | 24.164 | 26.926 |
| AverageTemperatureUncertainty | 2145.0 | 0.638233 | 0.547605 | 0.091 | 0.226 | 0.398 | 0.970 | 3.699 |
####Canada In [16]:
data_canada.head()Out[16]:
| ID | dt | AverageTemperature | AverageTemperatureUncertainty | Country |
|---|---|---|---|---|
| 97255 | 1768-09-01 | 5.257 | 3.107 | Canada |
| 97256 | 1768-10-01 | -3.393 | 2.981 | Canada |
| 97257 | 1768-11-01 | -12.829 | 3.967 | Canada |
| 97258 | 1768-12-01 | -20.582 | 4.622 | Canada |
| 97259 | 1769-01-01 | -24.756 | 4.722 | Canada |
In [17]:
data_canada.describe().TOut[17]:
| count | mean | std | min | 25% | 50% | 75% | max | |
|---|---|---|---|---|---|---|---|---|
| AverageTemperature | 2504.0 | -5.216659 | 12.878074 | -28.736 | -17.7025 | -4.7285 | 7.41275 | 14.796 |
| AverageTemperatureUncertainty | 2504.0 | 1.256211 | 1.046127 | 0.123 | 0.2870 | 0.8980 | 2.12025 | 5.275 |
Note that the variations in the average temperature uncertainty are greater in Brazil, Venezuela, Mexico and Canada, in that order, compared with Chile and Argentina.
Annual increase in the global average temperature
In [18]:
annual_mean_global = data_global.groupby(data_global["dt"].dt.year).mean()
reference_temperature_global = annual_mean_global.loc[1951:1980].mean()["LandAndOceanAverageTemperature"]
annual_mean_global["Anomaly"] = annual_mean_global["LandAndOceanAverageTemperature"] - reference_temperature_global
In [19]:
plt.figure()
plt.style.use("fivethirtyeight")
annual_mean_global.loc[1960:2015]["Anomaly"].plot(figsize = (10,5), grid=True, legend=True)
plt.title("Anomalia anual de la temperatura promedio global")
plt.xlabel('')
plt.ylabel('Anomalia de la temperatura')
plt.show()
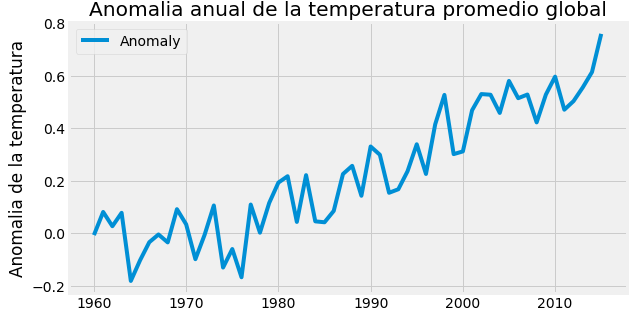
Note that the annual temperature increase shows an upward trend that has grown in recent years; this increase in 2015 was 0.75 degrees, which is consistent with climate change.
Venezuela.
The same calculation is done for the case of Venezuela. In [20]:
annual_mean_vzla = data_vzla.groupby(data_vzla["dt"].dt.year).mean()
reference_temperature_vzla = annual_mean_vzla.loc[1951:1980].mean()["AverageTemperature"]
annual_mean_vzla["Anomaly"] = annual_mean_vzla["AverageTemperature"] - reference_temperature_vzla
In [21]:
annual_mean_vzla.head()Out[21]:
| dt | AverageTemperature | AverageTemperatureUncertainty | Anomaly |
|---|---|---|---|
| 1824 | 24.896545 | 1.516091 | -0.420966 |
| 1825 | 25.071583 | 1.552083 | -0.245928 |
| 1826 | 24.871900 | 1.440800 | -0.445611 |
| 1827 | 25.156273 | 1.474182 | -0.161238 |
| 1828 | 24.751818 | 1.516727 | -0.565693 |
In [22]:
annual_mean_vzla.tail()Out[22]:
| dt | AverageTemperature | AverageTemperatureUncertainty | Anomaly |
|---|---|---|---|
| 2009 | 26.084917 | 0.353917 | 0.767406 |
| 2010 | 26.150250 | 0.341333 | 0.832739 |
| 2011 | 25.677333 | 0.336750 | 0.359822 |
| 2012 | 25.688583 | 0.401417 | 0.371072 |
| 2013 | 25.912875 | 0.484500 | 0.595364 |
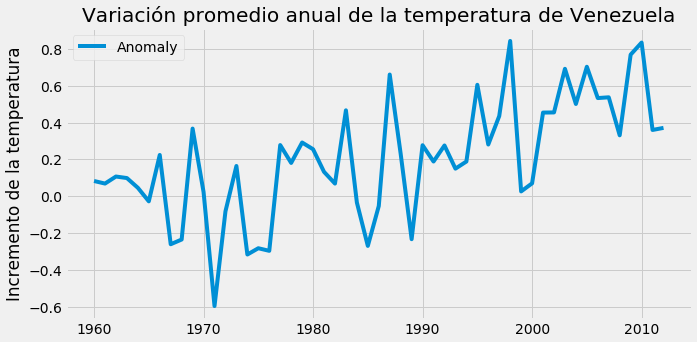
The last record is from 2013, when the increase was 0.595 degrees; there was a peak in 2010 of 0.8332 degrees. In [23]:
plt.figure()
plt.style.use("fivethirtyeight")
annual_mean_vzla.loc[1960:2012]["Anomaly"].plot(figsize = (10,5), grid=True, legend=True)
plt.title("Variación promedio anual de la temperatura de Venezuela")
plt.xlabel('')
plt.ylabel('Incremento de la temperatura')
plt.show()
Argentina
In [24]:
annual_mean_arg = data_arg.groupby(data_arg["dt"].dt.year).mean()
reference_temperature_arg = annual_mean_arg.loc[1951:1980].mean()["AverageTemperature"]
annual_mean_arg["Anomaly"] = annual_mean_arg["AverageTemperature"] - reference_temperature_arg
In [25]:
annual_mean_arg.head()Out[25]:
| dt | AverageTemperature | AverageTemperatureUncertainty | Anomaly |
|---|---|---|---|
| 1855 | 11.729250 | 1.711875 | -3.090742 |
| 1856 | 13.998750 | 1.553167 | -0.821242 |
| 1857 | 14.221083 | 1.993417 | -0.598908 |
| 1858 | 14.015667 | 1.770750 | -0.804325 |
| 1859 | 14.414583 | 1.635583 | -0.405408 |
In [26]:
annual_mean_arg.tail()Out[26]:
| dt | AverageTemperature | AverageTemperatureUncertainty | Anomaly |
|---|---|---|---|
| 2009 | 15.534417 | 0.215750 | 0.714425 |
| 2010 | 15.078833 | 0.218917 | 0.258842 |
| 2011 | 15.339667 | 0.219833 | 0.519675 |
| 2012 | 15.689000 | 0.265750 | 0.869008 |
| 2013 | 14.457125 | 0.276500 | -0.362867 |
In [27]:
plt.figure()
plt.style.use("fivethirtyeight")
annual_mean_arg.loc[1960:2012]["Anomaly"].plot(figsize = (10,5), grid=True, legend=True)
plt.title("Variación promedio anual de la temperatura de Argentina")
plt.xlabel('')
plt.ylabel('Incremento de la temperatura')
plt.show()
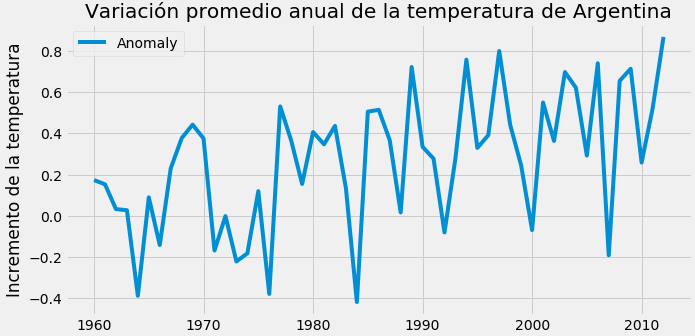
In the case of Argentina, the slope of the temperature increase trend is less pronounced.
Brazil
In [28]:
annual_mean_brasil = data_brasil.groupby(data_brasil["dt"].dt.year).mean()
reference_temperature_brasil = annual_mean_brasil.loc[1951:1980].mean()["AverageTemperature"]
annual_mean_brasil["Anomaly"] = annual_mean_brasil["AverageTemperature"] - reference_temperature_brasil
In [29]:
annual_mean_brasil.head()Out[29]:
| dt | AverageTemperature | AverageTemperatureUncertainty | Anomaly |
|---|---|---|---|
| 1832 | 23.858583 | 1.734500 | -1.072247 |
| 1833 | 24.517833 | 1.450083 | -0.412997 |
| 1834 | 24.346750 | 1.498083 | -0.584081 |
| 1835 | 23.537500 | 1.298583 | -1.393331 |
| 1836 | 23.921167 | 1.426083 | -1.009664 |
In [30]:
annual_mean_brasil.tail()Out[30]:
| dt | AverageTemperature | AverageTemperatureUncertainty | Anomaly |
|---|---|---|---|
| 2009 | 25.600583 | 0.185667 | 0.669753 |
| 2010 | 25.812417 | 0.158000 | 0.881586 |
| 2011 | 25.428917 | 0.204833 | 0.498086 |
| 2012 | 25.717083 | 0.231000 | 0.786253 |
| 2013 | 25.348125 | 0.262250 | 0.417294 |
In [31]:
plt.figure()
plt.style.use("fivethirtyeight")
annual_mean_brasil.loc[1960:2012]["Anomaly"].plot(figsize = (10,5), grid=True, legend=True)
plt.title("Variación promedio anual de la temperatura de Brasil")
plt.xlabel('')
plt.ylabel('Incremento de la temperatura')
plt.show()
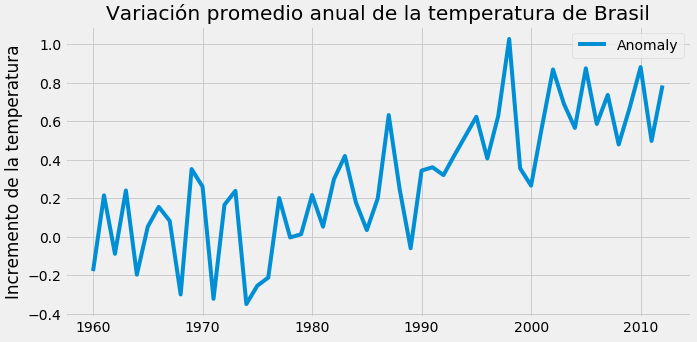
In the case of Brazil, a strong increase is noticeable in the 90s with a peak of more than 1 degree, after which the trend has stabilized at 0.79 degrees.
Chile
In [32]:
annual_mean_chile = data_chile.groupby(data_chile["dt"].dt.year).mean()
reference_temperature_chile = annual_mean_chile.loc[1951:1980].mean()["AverageTemperature"]
annual_mean_chile["Anomaly"] = annual_mean_chile["AverageTemperature"] - reference_temperature_chile
In [33]:
annual_mean_chile.head()Out[33]:
| dt | AverageTemperature | AverageTemperatureUncertainty | Anomaly |
|---|---|---|---|
| 1855 | 7.070125 | 1.424125 | -2.510742 |
| 1856 | 8.664083 | 1.319250 | -0.916783 |
| 1857 | 8.645917 | 1.439250 | -0.934950 |
| 1858 | 8.810250 | 1.428333 | -0.770617 |
| 1859 | 9.245583 | 1.376917 | -0.335283 |
In [34]:
annual_mean_chile.tail()Out[34]:
| dt | AverageTemperature | AverageTemperatureUncertainty | Anomaly |
|---|---|---|---|
| 2009 | 9.994417 | 0.281917 | 0.413550 |
| 2010 | 9.712833 | 0.340000 | 0.131967 |
| 2011 | 10.032250 | 0.322250 | 0.451383 |
| 2012 | 10.272583 | 0.384583 | 0.691717 |
| 2013 | 9.877375 | 0.393875 | 0.296508 |
In [35]:
plt.figure()
plt.style.use("fivethirtyeight")
annual_mean_chile.loc[1960:2012]["Anomaly"].plot(figsize = (10,5), grid=True, legend=True)
plt.title("Variación promedio anual de la temperatura de Chile")
plt.xlabel('')
plt.ylabel('Incremento de la temperatura')
plt.show()
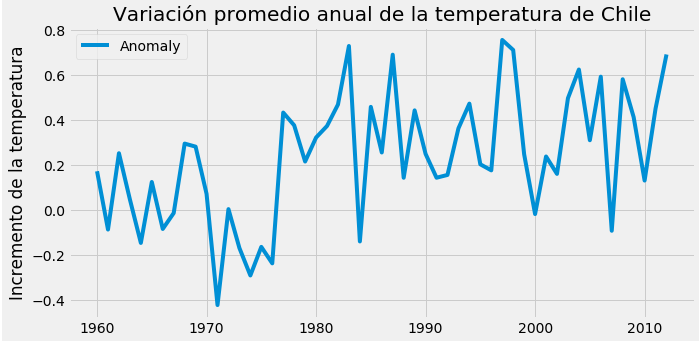
The variation does not exceed 0.8 degrees of temperature, with a strong increase between the 70s and 80s and then a peak in the 90s.
Mexico
In [36]:
annual_mean_mexico = data_mexico.groupby(data_mexico["dt"].dt.year).mean()
reference_temperature_mexico = annual_mean_mexico.loc[1951:1980].mean()["AverageTemperature"]
annual_mean_mexico["Anomaly"] = annual_mean_mexico["AverageTemperature"] - reference_temperature_mexico
In [37]:
annual_mean_mexico.head()Out[37]:
| dt | AverageTemperature | AverageTemperatureUncertainty | Anomaly |
|---|---|---|---|
| 1835 | 18.993250 | 1.684083 | -1.745911 |
| 1836 | 19.587167 | 1.695333 | -1.151994 |
| 1837 | 19.671083 | 1.647667 | -1.068078 |
| 1838 | 19.337000 | 1.862417 | -1.402161 |
| 1839 | 19.785833 | 1.603000 | -0.953328 |
In [38]:
annual_mean_mexico.tail()Out[38]:
| dt | AverageTemperature | AverageTemperatureUncertainty | Anomaly |
|---|---|---|---|
| 2009 | 21.546083 | 0.205917 | 0.806922 |
| 2010 | 20.852917 | 0.217750 | 0.113756 |
| 2011 | 21.599333 | 0.245333 | 0.860172 |
| 2012 | 21.652417 | 0.324500 | 0.913256 |
| 2013 | 22.219222 | 0.365111 | 1.480061 |
In [39]:
plt.figure()
plt.style.use("fivethirtyeight")
annual_mean_mexico.loc[1960:2012]["Anomaly"].plot(figsize = (10,5), grid=True, legend=True)
plt.title("Variación promedio anual de la temperatura de Mexico")
plt.xlabel('')
plt.ylabel('Incremento de la temperatura')
plt.show()
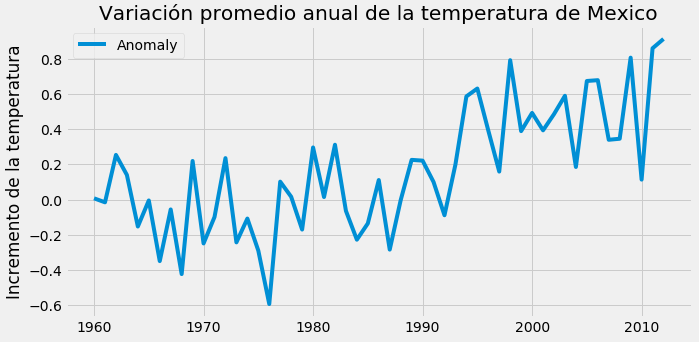
Note the upward trend of the temperature in Mexico, reaching 2013 at 1.48 degrees above the average.
####Canada In [40]:
annual_mean_canada = data_canada.groupby(data_canada["dt"].dt.year).mean()
reference_temperature_canada = annual_mean_canada.loc[1951:1980].mean()["AverageTemperature"]
annual_mean_canada["Anomaly"] = annual_mean_canada["AverageTemperature"] - reference_temperature_canada
In [41]:
annual_mean_canada.head()Out[41]:
| dt | AverageTemperature | AverageTemperatureUncertainty | Anomaly |
|---|---|---|---|
| 1768 | -7.886750 | 3.66925 | -2.969253 |
| 1769 | -3.427875 | 3.50550 | 1.489622 |
| 1770 | NaN | NaN | NaN |
| 1771 | NaN | NaN | NaN |
| 1772 | NaN | NaN | NaN |
In [42]:
annual_mean_canada.tail()Out[42]:
| dt | AverageTemperature | AverageTemperatureUncertainty | Anomaly |
|---|---|---|---|
| 2009 | -4.135083 | 0.231833 | 0.782414 |
| 2010 | -1.887917 | 0.218583 | 3.029581 |
| 2011 | -3.557083 | 0.232583 | 1.360414 |
| 2012 | -3.176833 | 0.300083 | 1.740664 |
| 2013 | -1.640667 | 0.533667 | 3.276831 |
In [43]:
plt.figure()
plt.style.use("fivethirtyeight")
annual_mean_canada.loc[1960:2012]["Anomaly"].plot(figsize = (10,5), grid=True, legend=True)
plt.title("Variación promedio anual de la temperatura de Canadá")
plt.xlabel('')
plt.ylabel('Incremento de la temperatura')
plt.show()
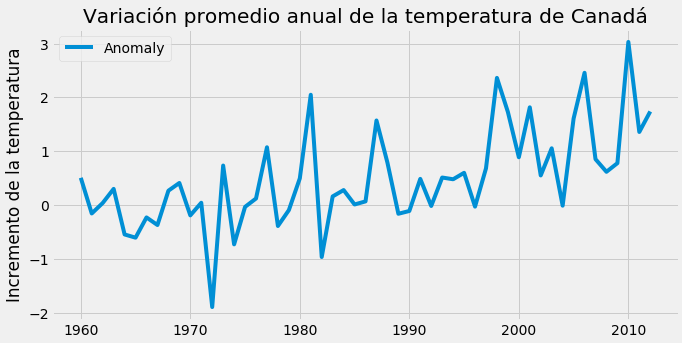
Note the upward trend of the temperature in Canada, and the worrying thing is that the variation exceeds 3 degrees in 2013.
Annual CO2 levels in the Atmosphere
In [44]:
plt.figure()
plt.style.use("fivethirtyeight")
annual_co2_ppm = co2_ppm.groupby(co2_ppm["Year"]).mean()
annual_co2_ppm.loc[1960:2015]["Carbon Dioxide (ppm)"].plot(figsize = (10,5), grid=True, legend=True)
plt.title("Nivel anual global de CO2 en la Atmosfera")
plt.ylabel("CO2 partes por millón")
plt.show()
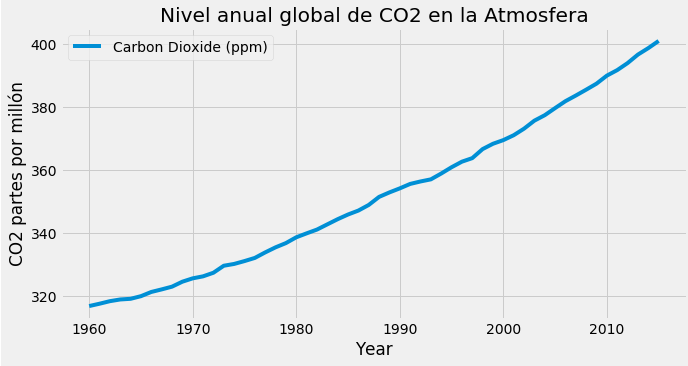
Note the annual increase with an upward trend.
The relationship between CO2 and temperature is calculated.
In [45]:
annual_co2_temp = pd.merge(annual_mean_global.loc[1960:2015], annual_co2_ppm.loc[1960:2015], left_index=True, right_index=True)
annual_co2_temp = annual_co2_temp[["LandAndOceanAverageTemperature", "Anomaly", "Carbon Dioxide (ppm)"]].copy()
annual_co2_temp.corr()
Out[45]:
| LandAndOceanAverageTemperature | Anomaly | Carbon Dioxide (ppm) | |
|---|---|---|---|
| LandAndOceanAverageTemperature | 1.000000 | 1.000000 | 0.923603 |
| Anomaly | 1.000000 | 1.000000 | 0.923603 |
| Carbon Dioxide (ppm) | 0.923603 | 0.923603 | 1.000000 |
In [46]:
sns.heatmap(annual_co2_temp.corr())Out[46]:
<matplotlib.axes._subplots.AxesSubplot at 0x7fcacea9cdd8>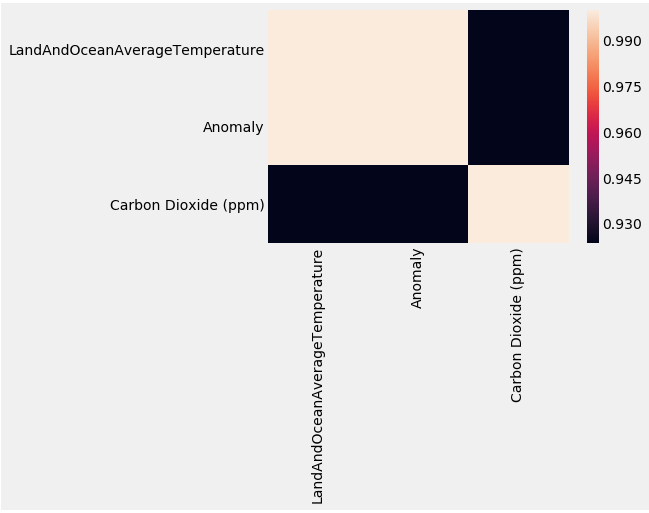
In [47]:
plt.figure(figsize=(10,8))
sns.scatterplot(x="Anomaly",y="Carbon Dioxide (ppm)", data=annual_co2_temp)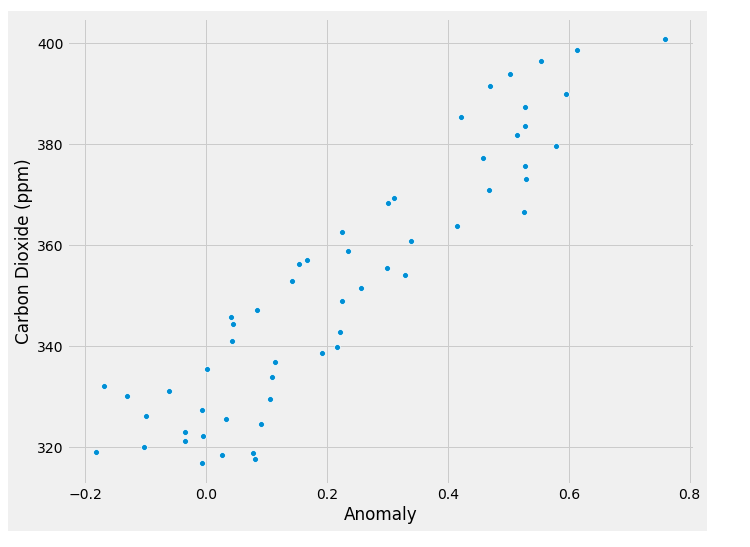
Out[47]:
<matplotlib.axes._subplots.AxesSubplot at 0x7fcace8d6c50>With the heat map and the scatter plot, the practically linear relationship between the temperature increase and Carbon Dioxide is evident. Both are related to Climate Change. In [ ]:
undefinedThe site where the data is stored has more files, for example temperature by city, to go into more detail on the situation per city. You can also keep looking for info on other countries; in the original article Greece was done, and here I tried Argentina, Brazil, Chile, Canada, Mexico and Venezuela.
Make a donation! If you liked the article you can make a donation with Bitcoin (BTC) using the digital wallet of your choice to the following address: 17MtNybhdkA9GV3UNS6BTwPcuhjXoPrSzV
Or by scanning the QR code from your wallet:
