There is a field of social network analysis: you can make trend charts and work out the origin of a tweet. The idea is to use the tweepy library to connect to Twitter, capture tweets from there, then run a sentiment analysis and plot the result.
Sentiment analysis refers to the use of natural language processing, text analysis and computational linguistics to identify and extract subjective information from sources (more information on wikipedia).
Sentiment analysis can be applied to any text: emails, web pages, posts on social networks such as twitter, facebook, google+, among others. With it you can get an approximation of the emotional evaluation a topic or person has at some moment on social networks or in the content evaluated.
The idea is to get the twitter traffic about a topic or person, apply sentiment analysis to it and plot the results.
This article is based on an English article published on freecodecamp titled Basic data analysis on Twitter with Python. That article develops a graphical TK application to get the information and then perform the capture, calculations and plots. The source code of that article's application is on github.
To get access to the twitter API you have to create an account on the page for applications that require it (broken link).
To authenticate, the following code will be used:
consumer_key = 'consumer key'
consumer_secret = 'consumer secrets'
access_token = 'access token'
access_token_secret = 'access token secret'
auth = tweepy.OAuthHandler(consumer_key, consumer_secret)
auth.set_access_token(access_token, access_token_secret)
api = tweepy.API(auth)In this case jupyter lab will be used to show the application, with code adjustments for reuse, for example so that it can run the analysis in Spanish or English.
The library to use will be tweepy, the text analysis library TextBlob, and matplotlib.
To install tweepy, pip3 will be used:
pip3 install tweepy textblobLet's first check the trends on twitter for Valencia (Venezuela); below is an image of the trends.
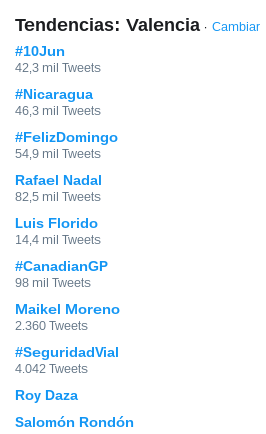
We will look for the sentiment analysis of the trend Rafael Nadal, searching 200 tweets in Spanish.
Here is the source code:
You can see the source code in the gitlab repository at this link.
#!/usr/bin/env python3
#Se importa la librería tweepy
import tweepy
#Se importa sleep, datetime, TextBlob y matplotlib
from time import sleep
from datetime import datetime
from textblob import TextBlob
import matplotlib.pyplot as plt
#Se define las variables para el acceso al API de twitter
consumer_key = ''
consumer_secret = ''
access_token = ''
access_token_secret = ''
#Se autentica en twitter
auth = tweepy.OAuthHandler(consumer_key, consumer_secret)
auth.set_access_token(access_token, access_token_secret)
api = tweepy.API(auth)
#se verifica que el usuario conectado en twitter es de uno
print(api.me().name)
#Se pregunta por la palabra a preguntar
palabra = input("Buscar: ")
#Se define la cantida de tweets a capturar
numero_de_Tweets = int(input(u"Número de tweets a capturar: "))
#Se define el idioma de los tweets a analizar
lenguaje = input("Idioma [es/en]:")
def ObtenerTweets(palabra="Trump",times=100,leguanje="en"):
#Se define las listas que capturan la popularidad
popularidad_list = []
numeros_list = []
numero = 1
for tweet in tweepy.Cursor(api.search, palabra, lang=lenguaje).items(numero_de_Tweets):
try:
#Se toma el texto, se hace el analisis de sentimiento
#y se agrega el resultado a las listas
analisis = TextBlob(tweet.text)
analisis = analisis.sentiment
popularidad = analisis.polarity
popularidad_list.append(popularidad)
numeros_list.append(numero)
numero = numero + 1
except tweepy.TweepError as e:
print(e.reason)
except StopIteration:
break
return (numeros_list,popularidad_list,numero)
def GraficarDatos(numeros_list,popularidad_list,numero):
axes = plt.gca()
axes.set_ylim([-1, 2])
plt.scatter(numeros_list, popularidad_list)
popularidadPromedio = (sum(popularidad_list))/(len(popularidad_list))
popularidadPromedio = "{0:.0f}%".format(popularidadPromedio * 100)
time = datetime.now().strftime("A : %H:%M\n El: %m-%d-%y")
plt.text(0, 1.25,
"Sentimiento promedio: " + str(popularidadPromedio) + "\n" + time,
fontsize=12,
bbox = dict(facecolor='none',
edgecolor='black',
boxstyle='square, pad = 1'))
plt.title("Sentimientos sobre " + palabra + " en twitter")
plt.xlabel("Numero de tweets")
plt.ylabel("Sentimiento")
plt.show()
numeros_list,popularidad_list,numero = ObtenerTweets(palabra,numero_de_Tweets,lenguaje)
GraficarDatos(numeros_list,popularidad_list,numero)
Running the program gives the following plot.
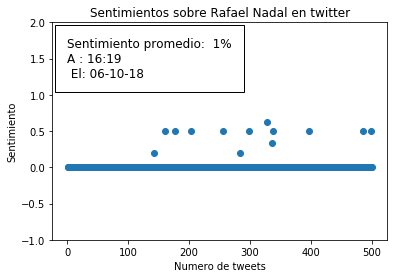
In Nadal's case, the average value is positive. There will be cases where the sentiment has a negative value, but in this case it would be best to increase the number of tweets captured, to get a better approximation of how people feel about what is said on twitter about Nadal.
If you have any question or comment, you can leave it in the comments of the post.
Make a donation! If you liked the article you can make a donation with Bitcoin (BTC) using the digital wallet of your choice to the following address: 17MtNybhdkA9GV3UNS6BTwPcuhjXoPrSzV
Or by scanning the QR code from your wallet:
